Monday, January 17, 2011

The Benefits of Exports

There has been a lot made recently that “export-led growth” is the path out of our current economic morass.  There is no doubt that Irish exports are large and increased up until 2008 and have rebounded again in 2010.  But what have we gained from this increase in exports? The answer: not a lot.

Here is a graph using Forfás data released last November.  The dataset covers about 85% of Irish exports.

Exports and Direct Expenditure

Since 2000 exports from risen by over 50% yet the direct expenditure from the companies that generate these exports has FALLEN, albeit by just over 1% (and this is nominal data).  Exports have risen (and have contributed positively to GDP) but the impact ‘on the ground’ has been less than stellar. 

Direct expenditure as defined by Forfás is made up of two elements

  • Payroll costs
  • Goods and services purchased from Irish sources

The Forfás data show that employment in the sectors that have generated this 50% increase in exports over the ten year period in the graph above has fallen from 310,000 to 250,000. We might have a closer look at this dataset in subsequent posts but the above is a useful starting point when examining the merits of an “export-led growth” strategy.  A breakdown by indigenously- and foreign-owned firms will form the basis for a subsequent post.

Saturday, January 15, 2011

The Market for Lemons

The Undercover Economist, Tim Harford, tries to buy a second hand car.

You can read Harford's take on it here, where he explains "why you can never buy a decent used car".

There are endless example of market failure due to the 'Lemons Problem'. A quick Google search came up with hundreds. Links to some of them are presented below (in no particular order). Browse through them to see the extent and impact of the Lemons Problem.

The Lemons Problem and Data Security
The Lemons Problem and New Houses
The Lemons Problem and Milk in India
The Lemons Problem and Politics in the Developing World
The Lemons Problem and Financial Assets
The Lemons Problem and Wine
The Lemons Problem and Online Retailing
The Lemons Problem and Toxic Assets
The Lemons Problem and Ebay
The Lemons Problem and Power Supplies
The Lemons Problem and Mortgages
The Lemons Problem and Corporate Bonds
The Lemons Problem and Used Computers (and Online Dating)
The Lemons Problem and Credit Markets
The Lemons Problem and Hedge Funds
The Lemons Problem and Men's Suits
The Lemons Problem and Teacher Pay
The Lemons Problem and Potatoes
The Lemons Problem and Ratings Agencies
The Lemons Problem and Internet Advertising
The Lemons Problem and Used Cars and here
The Lemons Problem and Karate
The Lemons Problem and Cholesterol
The Lemons Problem and Broadband Connections
The Lemons Problem and Business Loans
The Lemons Problem and Blogs
The Lemons Problem and Lemons
The Lemons Problem and the Credit Crisis
The Lemons Problem and the Bank Lending
The Lemons Problem and Internet News
The Lemons Problem and Prescription Drugs
The Lemons Problem and the Xbox
The Lemons Problem and Legal Aid
The Lemons Problem and Zhing-Zhong
The Lemons Problem and Lawyers
The Lemons Problem and Organic Food
The Lemons Problem and Prostitutes
The Lemons Problem and Rice and Managing Agencies
The Lemons Problem and IPOs
The Lemons Problem and Consumer Leads

Chemicals, Pharmaceuticals and an Export-Led Recovery

We have seen numerous times that the Chemical and Related Products sector dominates Irish merchandise exports.  The 2010 figures to September that exports from this category make up 59% of total goods exports and have been trending upwards, if erratically, for the past few years as shown below.

Chemical Exports to September 2010

This is been particularly true for the pharmaceutical sub-category of this group where exports are up 63.3% since 2007.

Pharmaceutical Exports to September 2010 

We might have an “export-led strategy”, but what we really need to see is if this increase in exports is being transformed into increases in employment.  Getting such employment data is hard but we can use the information on the “Modern Sector” from the CSO’s Industrial Production releases to get some insight (see table 3 on page 4).

It’s not a perfect fit, and the data does not go back very far, but we can get some insight into employment patterns in this booming export sector.

Chemical Sector Employment

The sector that accounts of nearly 60% of our exports and has shown large increases over the past few years has seen employment rise by 2,300 since the start of 2008 (from 39,900 to 42,200).  These 42,200 employees generate most of our exports 60% of our exports comprise just 2.3% of the 1,851,500 people employed in Ireland. 

Even if doubling exports in this category led to a doubling employment (and it won’t) it would only put a small dent in our unemployment crisis with 299,000 people now out of work.

Monday, January 10, 2011

Prospects for an “Export-Led Recovery”

Here are the slides I used in a seminar today to the Faculty of Commerce in UCC on the prospects of an export-led recovery in Ireland.

Slideshare seems to have thrown a few of the graphs out of whack and the vertical axis labels are missing on all the graphs.  Bar the area plots most of fine with the line charts largely unaffected.

Anyway the presentation had 30 slides to keep me going for the hour and has some interesting bits and pieces on Irish exports and imports of goods and services, but the crux of the matter can be gleaned from just four.

1. Net exports are surging ahead.

Balance of Trade

2. Our trade surplus is generated by our merchandise exports.

Balance of Goods and Services

3.  Until recently this was because imports were falling rather than exports rising.

Exports and Imports to November 2010

4.  Take away Chemicals and the balance you’re left with is …

Trade Balance excluding Chemicals

Friday, January 7, 2011

Ireland’s Import Performance

With the domestic economy in continued freefall, the positive growth recorded for Q3 2010 in the Quarterly National Accounts published before Christmas was entirely due to the performance of the trade sector.  We are now following an “export-led growth strategy” and our exports are being described as ‘strong’, ‘robust’ or ‘resilient’.

Indeed, the balance of trade in the Q3 National Accounts reached a record level.

Balance of Trade

However, the increase in the Balance of Trade seen in 2008 and 2009 was not down to a surge in exports, but rather a collapse in imports.  It is only in 2010 that exports resumed an upward trajectory.

Exports

As we can see even though exports were falling in 2008 and 2009 the net export position was improving because imports were falling even faster.  It is the poorer performance of imports relative to exports, rather than a standalone increase in exports that has given the slight positive sheen to our growth figures.  So as with our export performance, it is worth looking at our import performance in a little more detail.

In the National Accounts Quarterly the CSO provide a breakdown of imports by goods and services.
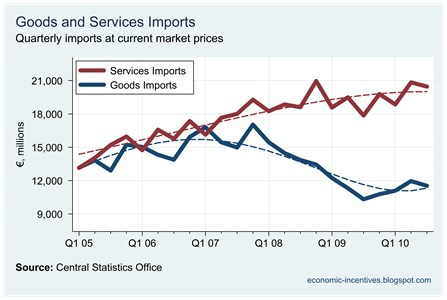
Goods and Services Imports

Quite clearly the drop in Irish imports has been on the goods side rather than in services.  This pattern of service imports is confirmed if we look at the equivalent figures from the Balance of Payments from which the National Accounts draw (graph here), with Royalty/License imports the fastest growing category.

But this doesn’t tell us why imports are falling.  To get a deeper understanding of the reasons for the fall in goods imports we can turn to the monthly External Trade statistics also provided by the CSO.  Here are the seasonally adjusted monthly merchandise imports since 2005.
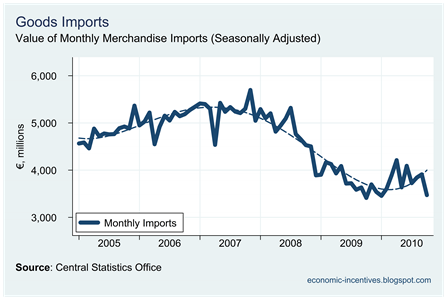
Monthly Imports to November 2010

What is of more interest, though is the type of goods we have stopped importing.  Imports can be generally divided into imports of goods for consumption and imports of intermediate or capital goods for production.  The patterns of these are rather revealing.

Goods Imports by Use

It is clear that the category showing the biggest drop is the imports of production materials.  The decline in the import of consumption goods has been far less pronounced.  Here same data in tabular form.  Click table to enlarge.

Imports by Use

Imports of production materials are nearly one-third on their 2007 levels.  Although the monthly series of production capital goods is a little more erratic we can see from the table that these imports are down a similar amount.  These are not good trends and although production material imports have risen very slightly in 2010, production capital goods imports have continued to fall.

The Quarterly National Accounts reveal that consumption expenditure for the first three quarters of 2010 is about 12% below the equivalent figure from 2007.  This ties in with the 14% drop seen in the imports of consumption goods.  It is noteworthy that imports of consumption goods in 2010 to September are running 6.7% ahead of the 2009 level.  Consumption goods now make up close to 32% of Ireland’s merchandise imports.

With the above External Trade figures revealing that consumption imports have risen in 2010 and Retail Sales figures showing the retail expenditure is lower than last year, it appears that the bite of the continuing falls in consumption expenditure is hurting domestic producers more.

It is not a good sign when an economy’s “growth” figure is driven by a drop in this category.  The following table provides details of the ten main NACE categories provided by the CSO for the January to September period for the years 2007, 2009 and 2010.  Click table to enlarge.
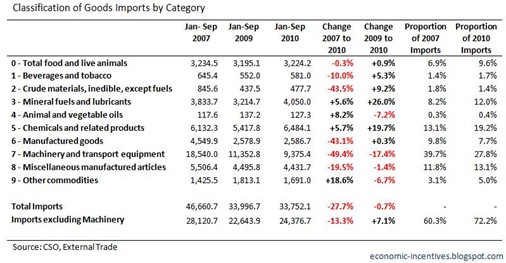
Imports by Category to September

From the peak in 2007, goods imports for the first nine months of the year, have fallen by nearly €13 billion or 27.7%.  Of this fall, more than €9 billion is accounted for by the near 50% drop in machinery and transport equipment imports.  No category has shown a larger percentage decrease.  This category made up 39.7% of total merchandise imports in 2007 but by 2010 this proportion was down to 27.8%.

Here are the sub-categories that make up the Machinery and Transport Equipment group.

Machinery and Transport Equip Imports

Since 2007 there have been substantial drops in specialised machinery (-61%), general machinery (-45%), office machines and computers (-71%) and electrical machinery (-35%).  All of these categories have continued to fall in 2010. 

It is possible that the huge drop in the import of Office Machines and Computers is linked to the comparable drop of exports in the same category.  We may have been importing intermediate materials and exporting the finished products.  There may be an associated drop in employment (Dell?) with this drop in imports.  Remember this the next time someone tells you imports are ‘bad’ for the economy.

Computer Exports and Imports

Imports of road vehicles are down more than two-thirds of the 2007 peak but in line with the new car sales figures they did exhibit a rebound in 2010.  This is the only significant sub-category in this group to show growth in 2010.

Outside of the substantial drops in the sub-categories of Machinery and Transport Equipment shown above the sub-category with the next largest drop since 2007 is NACE 67 – Iron and Steel which has fallen 60% ( from imports of €819 million in the first nine months of 2008 to only €325 million in 2010).  This is likely linked to the collapse of the construction sector.

The sub-category with the best growth since 2007 is NACE 54 – Pharmaceutical and Medical Products, which is up 40% (from imports of €1,830 million in 2007 to €2,559 million in 2010).  This is also our best export category but there is a huge disjoint between imports and exports.  See graph here.  There is no merchandise imports category that can account for the huge increase in medical and pharmaceutical exports since 2007 but it may be linked to increase in service imports payments on patent royalties shown above as the biggest cost of a pharmaceutical product is the research (which is not undertaken in Ireland).

The poor import performance, and in particular the very poor merchandise import performance, since 2007 might be having a positive effect on Ireland’s growth arithmetic, but the outlook for the economy cannot be positive as long as production materials are the main cause of the fall in imports.  An “export-led growth strategy” might provide the numbers that give the appearance of growth but unless this is converted in job growth there will be no real improvement in the economy.  The spin-doctors might be crowing about our export performance but is equally as likely (maybe more so) that increases in our imports are what we actually need.

New Car Sales

The turn of the year gives us the opportunity to finish this.  New car sales in the last three months of 2010 continued to outstrip the 2009 figures.

Car Sales to December

According to figures released by SIMI there were 5,244 new cars sold in the last three months of the year.  This is a 123% increase on the 2,350 sold in the same period in 2009.  In fact, the Q4 new car sales in 2010 were only 9.6% behind the peak Q4 level from 2007 (although sales for the year were still down nearly 100,000 on 2007).

Thursday, January 6, 2011

Austerity?

We have now had three years of so-called austerity budgets in Ireland that have focussed largely on expenditure cuts.  So how much has expenditure being cut by?  Lets start with gross expenditure by central government.

Gross Expenditure

At first glance it would appear as if the austerity measures are beginning to bite.  After showing a continual rise to 2009, gross central government expenditure fell from €75.3 billion in 2009 to €69.1 billion in 2010.  However let’s break this down by Voted and Non-Voted expenditure.  Voted expenditure is essentially the money allocated to government departments and offices.  Non-voted expenditure is money that is spent under specific legislation and does not require a separate ‘vote’.

Voted and Non-Voted Gross Expenditure

Since 2008 the increase in voted expenditure has moderated and actually decreased slightly in 2010.  However, most of the decrease in gross expenditure that occurred in 2010 is due to non-voted expenditure.  So called ‘budgetary cuts’ on voted expenditure have had little effect so far in tempering expenditure, with any reduction seen mainly in voted capital expenditure as shown in the next graph.

Voted Current and Capital Expenditure

In fact, if we look at breakdown of total expenditure into current and capital expenditure we see that all of the decrease can be attributed to capital expenditure.  There has been no year when day-to-day or current expenditure has fallen.  None.

Current and Capital Gross Expenditure

When looking at non-voted expenditure it is clear there has been no actual cuts in expenditure.  It is the result of some once-off events in non-voted capital expenditure.

Non-Voted Current and Capital Expenditure

Non-voted current expenditure (mainly interest payments on the National Debt) has been increasing since 2008.  The apparent reduction in non-voted expenditure seen in 2010, is simply due to the once-off increase in non-voted capital expenditure that occurred in 2009.  In 2009 there was €4 billion transferred to Anglo Irish Bank and €3 billion paid to the NPRF to fund the recapitalisations of AIB and BOI.  These payments did not occur in 2010 (and most bank recapitalisations since have been off-balance sheet).

On the current side there has been some reduction in voted current expenditure but this has been more than offset by the increase in interest payments that is pushing up non-voted current expenditure.  Any ‘savings’ being made on current expenditure are more than offset by expenditure increases elsewhere.

Voted and Non-Voted Current Expenditure

The one area where there has been actual reductions is in capital expenditure.  We saw above why non-voted capital expenditure spiked in 2009 and fell sharply in 2010.  Voted (or departmental) capital expenditure has been cut sharply since 2008 and in two years has been reduced from €9.0 billion to €6.4 billion.

Voted and Non-Voted Capital Expenditure

Cutting, or just hiding, capital expenditure is the ‘low-lying fruit’ of an austerity package.  It does not offer sufficient long-term reductions if order is to be restored to the public finances.  Closing a €19 billion budget deficit requires expenditure cuts and tax increases.  Thus far we have grasped neither nettle properly.

Delaying capital projects like road improvements, new railways, metros and other public construction projects does not ‘save’ money as most of these are projects will have to undertaken at some point in the future anyway.  A properly implemented austerity programme has to look to cut current voted expenditure.  The main elements of this expenditure are transfer payments, public sector pay and pensions, and expenditure on goods and services.  The 2010 figures suggest we have seen little austerity so far and it is too early to forecast the impact of the changes announced in Budget 2011.

The budget deficit remains (and is actually getting bigger!).  Is there anyone who will grasp the painful nettle?

 
Unsecured Loans Proudly Powered by Blogger