Thursday, July 7, 2011

Bond Yields go vertical

Yesterday was a staggering day for eurozone government bond yields.  The trigger was Moody’s downgrade of Portuguese government bonds by four notches.  The most dramatic response for Irish bonds was in the two-year yields constructed by Bloomberg

[Note: Ireland do not have any two-year bonds issued.  The yield is calculated using the market prices of bonds which are due to mature in around two years.  The full list of Irish bonds can be seen here.]

Here is the two-yield on Irish bonds for the past three months from Bloomberg.

Bond Yields 3M to 06-07-11

It went vertical yesterday!  This was the largest recorded basis point jump in Irish bond yields.  The two year yield  jumped more that 220 basis points, from just below 13% to just over 15%. 

The yield on the “D-day bonds” due to mature on the 15th January 2014 on which the Bloomberg two-year yield calculation is largely based surged to 15.20%.  The EU/IMF rescue package was designed to allow a return to raising money from these markets 12 months from now.  The longer the rescue package goes on the further from that we seem to be getting.

Wednesday, July 6, 2011

Mid-Year Exchequer Returns

The Exchequer Returns covering the first six months of the year have been released by the Department of Finance.  Here are the associated documents.

Here we will focus on the performance of tax revenue for the first six months of the year.  Tax revenue is up on 2010 but the rate of increase is lower than the 6.7% seen in April.  By the end of June, tax revenue was €847 million ahead of last year but as we will see below this is likely to an illusory increase.

Cumulative Tax Revenue to June

Every month this year has seen an increase in tax revenue compared to the same month last year.  The increase was largest in April and we explored the reasons for that here.

Monthly Tax Revenues to May

Here is a look at the revenue by the eight main tax heads reported in the Exchequer Account.  It is clear that all of the €847 million increase in tax is attributable to tax collected under the Income Tax heading.  The key barometer tax VAT is down on last year.

Cumulative Tax Revenues to May

According to the QNHS employment in the first quarter of last year was 1,857,600 and this had fallen to 1,804,200 in the same quarter this year.  The Earnings and Labour Costs Survey has average weekly earnings falling €683.43 to €674.56.  So the two key measures that feed into income tax, the number of workers and their earnings, are both down on last year.  It is pretty evident that it is not a labour market improvement that is driving the increase in Income Tax.

Income Tax is up just over €1 billion, but the €2 billion that was previously collected by the Department of Health as the Health Levy is now included under the Income Tax heading in the Exchequer Account following the introduction of the Universal Social Charge.  It is pretty clear that if a like-for-like comparison was made with last year that Income Tax revenue would be down. 

It is only because of changes in the system of public finances that it appears to be up.  We continue to collect less tax revenue rather than more.  Changing the name of money previously collected as a levy to a tax does not mean that more money is being collected.

You can read some of my views on the overall Exchequer Balance in this post over on The Irish Economy blog.

Friday, July 1, 2011

100,000 More People and our Economic Indicators

Yesterday’s preliminary Census 2011 results have suggested that the population is 100,000 larger than previously estimated.  We now have an extra céad míle daoine to be giving out the céad míle fáilte.

At first glance this would just appear to be more of a demographic than economic issue, and not one that is related to the banking, public debt and unemployment crises we face.  However, the impact of this new population figure from the Census will not have been accounted for in the other statistics from the CSO which mainly come from surveys.

A survey like the QNHS which covers 20,000 might be very good at providing the breakdown and composition of the population in proportions but it struggles when estimating the overall size.  This is why the Census is undertaken rather than rely on a survey.

As a rough division we can break the population into three groups

  • 0 – 14 years
  • 15 – 64 years
  • 65 and over

Additions to the 0 to 14 group are likely to be mainly the result of births (though migration will also play a role).  Counting the number of births should not be a problem.  Without wanting to be morbid, exit from the 65 and over group will largely be via deaths which is again easily measurable and additions will generally come from natural aging rather than migration.  It would appear that the most difficult group to track, and the one where most of the extra 100,000 are likely to be found is in the 15 to 64 age group.

We don’t know anything about these 100,000 but we can draw some inferences based on the survey findings of the QNHS.  For simplicity we will assume that all of these 100,000 are in the 15 to 64 age group though this will clearly not be the case.  We will also assume that the characteristics of this group match the characteristics of the population as a whole, though again this may not be exactly the case.

The employment rate rate among those aged 15 to 64 is 58.9% so there could be around 60,000 more in employment than previously estimated.  This would be an increase of 3.3% on the current employment estimate of 1.8 million.

There are 456,000 people on the live register.  Of these 86,000 are casual or part-time workers so there are 370,000 people on the live register with no employment.  The CSO’s official measure of unemployment is 295,000, and when asked to self-assess there are 352,000 who classify themselves as unemployed. 

These are based on survey data from the QNHS so both could increase to closer reflect the number of unemployed from the Live Register.  It is unlikely that the revised population figure will change the estimated unemployment rate.  There has been a change in the size of the population rather than a change in the composition of it.

It is hard to know what impact this more accurate population figure will have on the National Accounts.  As in the labour market the CSO are more likely to get the rates correct rather than the absolute size.  These change to the population figure is unlikely to make significant changes to the dramatic negative growth rates we have experienced in recent years.  There could be some moderation of the drops in the past year of two but nothing huge.

What is more likely to change is the absolute levels and all GDP figures could be revised up without huge changes to the growth rates.  It is impossible to say how the CSO would go about this.  Nominal GDP in 2010 is now estimated to be €156 billion.  A 3.3% rise in that would bring it up to €161 billion.

The first revision of our 2010 GDP by the CSO saw our debt/GDP ratio fall from 96.2% to 94.9%.  If the revision here was applied then the 2010 debt/GDP ratio would be 91.9%.  We are still accumulating debt but maybe we are further away than we thought from the “terminal” level of 120% that many believe we are cascading inevitably towards.

The CSO will wait until official Census results are available but it will be interesting to see how the unearthing of these 100,000 people will play out in out economic statistics over the next few years.  This is largely a statistical exercise and does not change the hugely downbeat economic reality we face, but it will be more useful to have statistics that better reflect that reality than not.

Wednesday, June 29, 2011

Retail Sales Index Falls Again

The May Retail Sales Index was released by the CSO earlier today.  The up-down volatility in the series that was seen around the turn of the year has now been replaced by downward momentum.

Ex Motor Trades Index to May

Both the value and volume series are now down to the minimums there were recorded last December.  The drop to these levels in December was largely influenced by the extreme cold weather that the country experienced.  There is no such meteorological explanation for the return to these levels in May.

Annual Change Ex Motor Trade Index to May

Unsurprising, the annual changes are moving further away from zero.  Value is now 3.5% behind last year and volume 5.1% down on last year.  We had expected that the annual comparisons around now would be negative even if the index had managed to stop falling. It hasn’t and the annual drops are getting larger.

Monthly Change Ex Motor Trade Index to May

The recent volatility is highlighted by the monthly changes but the jumps from positive to negative have been replaced by a series of negative monthly changes.  It must be all those pesky savers!

Presentation – Ireland’s Public Debt Crisis

Here are the slides I used for a presentation in UCC on Ireland’s Public Debt Crisis.

Monday, June 27, 2011

What are we saving?

There has been a lot of discussion following from Michael Noonan’s comments last week that “what we really need is for people to go into the shops and start buying again”.   Stephen Kinsella has a good post on this.  As a follow up to this it is useful to consider just what it is Irish people are saving.  To start here is a highly stylised and artificial example.

Consider that society is made up of two groups and that the disposable income of each group is 50.  The first group is the Thrifty Group. Of their disposable income they spend 40 and save 10.  The second group is the Profligate Group. They spend their income of 50and also borrow an additional 10 to increase their consumption to 60.

In this first period aggregate disposable income is 100 and total consumption is 100.  The savings rate is zero.

We then move to the second period.  The situation and behaviour of the Thrifty Group does not change.  They continue to have a disposable income of 50, spending 40 and saving 10 of this.  We will also assume that the disposable income of the Profligate Group does not change but they are now unwilling/unable to borrow to fund their consumption and they spend their entire disposable income of 50.

In this second period aggregate disposable income is 100 and total consumption is 90.  The savings rate is 10% but this was driven by a change in borrowing behaviour.  There has been no change in savings behaviour.

Finally, consider a third period.  Again we will assume no change for the Thrifty Group but now the Profligate Group have to pay back the money they borrowed in Period One.  We will assume that this requires a repayment of five, thus reducing their consumption to 45.

In this third period aggregate disposable income is 100 and total consumption is 85.  The savings rate is now 15% but again it is not because of any increase savings behaviour.

In Ireland the savings rate has shot up in recent years. 

Household Savings Rate

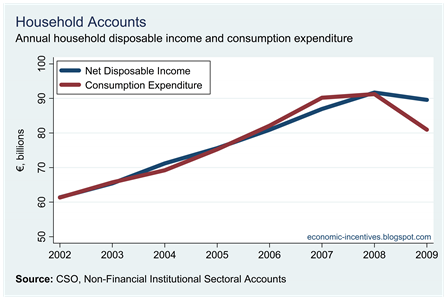
The suggestion from Michael Noonan is because this is as a result of an increase in savings behaviour.  It is true that a gap has emerged between household disposable income and household consumption.
Household Expenditure

Although the data in this graph only go to 2009 all indications are that this continued into 2010 and will likely continue in 2011 and 2012.  In economics, the definition of savings is disposable income that is not spent. 

In 2008, both disposable income and consumption expenditure were around €90 - €92 billion.  In 2009, household disposable income fell slightly but consumption expenditure dropped from €90 billion to €81 billion.  The assumption is that this €9 billion is money that households could have spent, but are now choosing to save.  As we saw with our stylised example above, this could be a factor of borrowing rather than saving.

If we look at household financial accounts we see that this is more than likely the case.  First here are household deposits.

Household Deposits

During 2006 to 2008 when the savings rate was low household deposits were rising.  When the savings rate shot up in 2009, the increase in deposits slowed and had even begun to decline slightly during the end of 2010.   This is an aggregate of deposits.  It is likely for some households that precautionary deposits are increasing while for other households deposits are decreasing as they use them to offset significant reductions in income.

The savings rate might be a hefty 12% but this is not been seen in household deposits.  Michael Noonan may want people to go out shopping but they do not have an extra savings to draw on, household deposits are falling.

So where is the 12% savings rate going?  Well, as explained above it could be driven by a fall in new borrowings.  The Credit, Money and Banking Statistics from the Central Bank show that household credit is now contracting.

Household Credit Growth

The drop in growth of consumer credit is evident and since 2008 has moved from growing at 18% per annum to falling at 18% per annum.  Even if household income and savings amounts had remained unchanged this huge turnaround in consumer credit would have seen consumption expenditure fall.

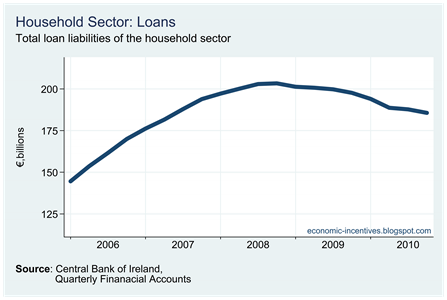
Finally here is the aggregate amount of loans owed by households.
Household Loans

Since peaking in the middle of 2008, the amount owed on household loans has fallen from €203 billion to €185 billion.  Short-term loans have fallen from €14 billion to €9 billion.

The household sector may have a savings rate of close to 12% but there are no swelling deposits that could be used to boost consumption.  The savings rate has shot up for two reasons:

  1. Households are no longer borrowing to fund their consumption expenditure.
  2. Households are paying back the loans they previously used to fund their consumption expenditure.

One issue that cannot be addressed here is whether people are paying back these loans in an accelerated fashion.  The Financial Regulator produces data on mortgage arrears, those behind on their repayments.  It would be useful if we could get even a snapshot of those who are in mortgage advances, those ahead on their repayments. 

There may be households who are saving by paying down loans quicker than in the original contract.  It is difficult to say if this is true but the total amount of loans outstanding to households is falling quite rapidly.  It must be stated that it is falling from a huge height and is still 120% of GDP, well north of international averages.

So what impact is this huge savings rate having on household deposits? Very little.  What extra money is available for consumption? Not much.  There may be some money that is currently being used to accelerate the repayment of debt. This will continue for the medium term and once households have repaired their balance sheets they will be in a position to increase consumption relatively quickly.  It will take more than words from the Minister for Finance to get the tills rolling again.

Sunday, June 26, 2011

What can we default on?

Our continued insistence on paying unguaranteed debts in the banks has seen the State pour €46 billion into the six covered banks so far, with a further €18 billion or so to be provided as part of the ongoing recapitalisations.  Of this €64 billion, about €16 billion will have come from money that was built up in the NPRF, so by the end of this year the bank bailout will have created about €48 billion of debt.

There are many who view this as an unsustainable debt for the State to carry and that default is inevitable.  Personally I am still of the view that a sovereign default can be avoided but that does not mean that such a course of action should be discounted.   It is not inevitable but that does not mean it should not be considered as a policy option.

At the end of this year the General Government Debt will be around €170 billion.  In increasing order of importance that will be made up of the following components:

  • Retail Debt: €15 billion
  • Promissory Notes: €28 billion
  • EU/IMF Borrowings: €41 billion
  • Government Bonds: €86 billion

This €170 billion of debt will be about 108% of GDP.  The potential for substantial savings appears to be limited.  The €15 billion of retail debt is Prize Bonds, Post Office Bonds, Savings Certificates/Bonds and the National Solidarity Bonds.  It is very unlikely that there will be a default on these.

At the end of the year there will be €28 billion of Promissory Notes outstanding.  These are used by Anglo, and to a lesser extent, INBS as collateral with the Central Bank of Ireland to obtain Emergency Liquidity Assistance (ELA).   If payment is refused on these Promissory Notes, Anglo will not be a position to repay the ELA it is drawdown from the CBoI.  If that is the case who picks up the tab?  The answer is on page 104 of the CBoI’s 2010 Annual Report:

In addition, the Bank received formal comfort from the Minister for Finance such that any shortfall on the liquidation of collateral is made good.

The €28 billion of Promissory Notes seem an ideal candidate when considering a default as this money will disappear in the zombies that are Anglo and INBS with absolutely zero return for the State.  The problem is that it looks very difficult to escape the liabilities that are being covered by these Promissory Notes.

Default on the EU/IMF borrowings is a non-runner as these institutions have priority status on our list of creditors and are legally guaranteed to get their money back.  It may be possible to reschedule the repayment of these loans.  This repayment is due to begin in 2015.  Such a rescheduling would not be far removed from a default event but it would not reduce the aggregate amount of debt we are carrying.

That means we are down to the outstanding sovereign bonds that were issued prior to our shut-out from markets towards the end of 2008.  A full list of these can be seen here.  At the end of this year there will be €85 billion of these bonds outstanding. 

If a default is going to be worthwhile it would have to reduce our debt/GDP ratio to something around 75% that would mean the aggregate debt would have to be reduced from €170 billion to around €120 billion.

To make these €50 billion of savings it seems the only realistic possibility is to enforce significant haircuts on our outstanding government bonds.  This would have to be of the order of 60% across all government bonds to make the default worthwhile.  If the haircut is less than 60% it is hard to see how the savings to be made could offset the inevitable fallout of a default. 

It is unlikely that such a haircut could be introduced, but if it was it is more than a little incongruous that those who invested in senior bonds from our delinquent banks are getting their money back, while those who invested in the bonds of the country could be forced to carry losses.  Like lots of developments in the response to the crisis, this does not add up.

However, it does not seem that default could generate the required savings to make it a viable policy option.  We are not going to default on out retail debt.  The construction of the Promissory Notes makes it very difficult to escape from the liabilities they cover.  The EU/IMF have preferred creditor status and are virtually guaranteed to get repayment on their loans.  That leaves, our government bonds. 

The yields on these indicate that markets know that this is where the risk lies.  Current market prices have an in-built 40% write-down included in them.  The haircut would need to be half as large again to make it worthwhile.

 
Unsecured Loans Proudly Powered by Blogger