Friday, September 14, 2012

How much are the Promissory Notes worth?

This is a hollow exercise but the 2010 Annual Report for Anglo says:

The fair value of the promissory note is determined by the use of a valuation technique, based on a discounted cash flow methodology, which references observable market data. The fair value is calculated by discounting expected cash flows by reference to current observable market yields for comparable Irish government bonds.

Here are the four tranches of the Promissory Notes:

The 2010 column gives the annual coupon on the notes.   The interest rate was set using an equivalent Irish government bond at the time the tranche was issued.  The first three tranches were issued in the first half of 2010.  Tranche 4 was issued on the 31st December 2010, by which time Ireland had seen bond yields soar and entered an EU/IMF programme.  The annual coupon of the €9.1 billion in Tranche 4 is 8.6%. 

The promissory notes are like an amortising bond in which the interest and some of the capital is repaid each year.  With one-tenth of the capital amount repaid each year the average maturity of the notes is around five years.  The five-year yield as calculated by Bloomberg is currently around 3.9%.  This is nearly five percentage points lower than the coupon on Tranche 4.  What impact does this have on the fair value of the Promissory Notes?

As a simplified comparison, a €100 five-year bond with a coupon of 8.6% that yields 3.9% would have a current value of around €120.  The drop in Irish government bond yields over the past few weeks will do wonders for the aesthetics (rather than the realities) of the IBRC balance sheet.

This is indeed a hollow exercise but things like this probably account for part of the “technical discussions about technical things” we have been hearing about for nearly a year now in relation to rescheduling of the Promissory Notes.  Here is a reference from October 2011 and today in Nicosia at the informal Eurogroup meeting Michael Noonan once again referred to “technical talks”.

Maybe when these are finally concluded we will be a little like Joan Burton was in an early Dail debate on the Promissory Notes when she declared “we need a Powerpoint presentation on this.”

Bond yields, debt and deficits

It has been an incredible week for Irish government bond yields.  This table has the indicative yield as calculated by Bloomberg for a representative set of maturities on the last day of August and as of this morning.

Term Aug 31 Current Change
1-year 1.79% 1.36% -43bp
3-year 3.35% 2.05% -130bp
5-year 5.19% 3.82% -137bp
7-year 5.68% 4.62% -106bp
9-year 5.94% 5.27% -67bp

The largest proportionate drop has been in three-year yield but the drops have been right along the yield curve.  There has been no improvements in the Irish economy in the past few weeks that can explain these moves.

The announcement of Outright Monetary Transactions (OMTs) by Mario Draghi is important and at the same timeframe used above the Spanish five-year yield as calculated by Bloomberg has moved from 5.50% to 4.41%.  Clearly the moves by the ECB can explain a large part of the yield decrease but the drop for Ireland has been larger.

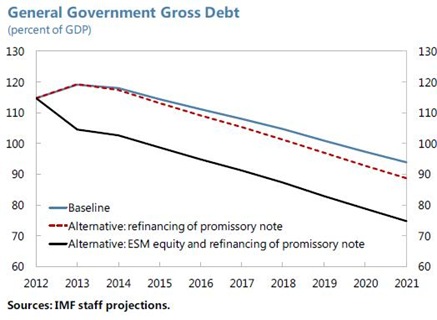
It is likely based on expectations of the “deal on bank debt” though this has been in the offing since the June 29th EU Council Meeting.  This week’s IMF Article IV Report on Ireland shows what could happen to Ireland’s debt ratio if this deal delivers at the top-end of expectations.
IMG GGD minus banks

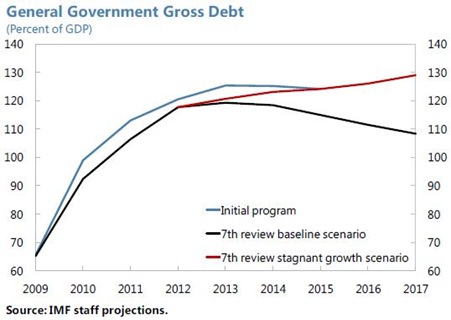
A debt ratio of around 80% of GDP by 2020 would be remarkable.  Of course, this is based on a benign growth scenario and a deal with the ESM for the viable banks (the ESM purchasing them for €24 billion) that is unlikely.  In the absence of the debt improvement agreement and underperformance of growth the following could happen.
IMF GGD stagnant growth

The stagnant growth scenario sees the debt at 130% of GDP as early as 2017 and continuing the rise.  This is not a sustainable position.

Current Irish bond yields are more reflective of the “baseline growth and ESM equity and refinancing of promissory note” scenario of the first graph than the “stagnant growth scenario” of the second.

The likely outcome will be between these.  A bank debt deal that doesn’t meet expectations or lethargic growth will bring the second graph into the focus of prospective buyers of Irish government bonds.  The current run of these bonds is a positive but the yields can rise much faster than they fall.

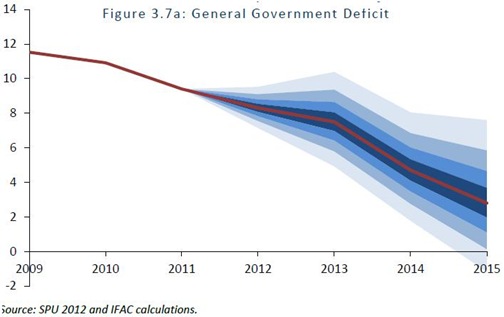
Also, as highlighted by yesterday’s Fiscal Advisory Council Report the biggest threat to debt sustainability is the continuing deficit.  While the debt deal will affect the level of Irish public debt the deficit will determine the trajectory.
FAC Deficit Fan

The FAC are pretty explicit that the risks are to the downside with larger deficits more likely than lower deficits.  The current plan as outlined in last April’s Stability Programme Update are for the deficit to just edge below 3% of GDP by 2015 (2.8%).   The FAC recommend a faster adjustment process which would bring the deficit down quicker, add to the likelihood that the public debt ratio will stabilise and provide buffers against growth underperformance.

Last week, updated National Income and Expenditure data from the CSO and some revisions from the Department of Finance showed that the 2011 ‘underlying’ General Government Deficit (i.e. excluding bank payments) was €14.3 billion or 9.0% of GDP.  In 2010 the ‘underlying’ deficit was €16.7 billion or 10.7% of GDP and in 2009 it was €18.8 billion or 11.7% of GDP.

[This measure of the ‘underlying’ deficit excludes bank recapitalisation payments but does not exclude banking-related revenues such as the Central Bank surplus, bank guarantee fees, dividends and other receipts.]

Since the ‘underlying’ deficit peaked in 2009, the nominal improvement was €2.1 billion in 2010 accelerating to €2.4 billion in 2011 and in terms of GDP the improvements have been one percentage point and 1.7 percentage points respectively.

For 2012, it looks like the rate of improvement will slow although it will be this time next year until that can be ultimately confirmed.  Most projections are for a deficit this year of around €13 billion or 8.3% of GDP and one of €12 billion or 7.5% of GDP in 2013 (though this is influenced by the of the ‘interest holiday’ on the promissory notes).

After seeing the deficit fall to 9.0% of GDP in 2009, the current plan is that it will fall by justa further 1.5 percentage points over the next two years to 7.5% of GDP.  This will add €25 billion to our borrowings.  Even by sticking to the terms of the Excessive Deficit Procedure there will still be a deficit of €5 billion in 2015.

The banking disaster beginning from 2008 has added about €45 billion to the general government debt.  The ‘underlying’ deficits over the same period have totalled around €63 billion.  Another €38 billion of deficits are expected to be accumulated over the next four years.  It is possible that the table of bond yields shown above won’t always look as positive.

Thursday, September 13, 2012

Core inflation rises again

After more than two and a half years where the upward pressure on inflation was coming from Energy Products and Mortgage Interest, the past few months have seen the overall inflation rate and the core inflation rate converge (while also increasing).

Core inflation is measured by excluding the impact of energy products and mortgage interest from the overall CPI.  These account for 17% of the overall CPI basket so ‘core’ inflation here is the remaining 83%.   It can be seen below that this measure of inflation is now running at its highest rate since the start of 2009.

Core Inflation August 2012

In August both overall inflation rate was 2.0% per annum with the core rate just above this.  The Energy Products category recorded 10% inflation over the past twelve months while Mortgage Interest in the CPI is now 13% lower than it was this time last year (this followed from Mario Draghi’s almost immediate decisions to reverse the 0.5 percentage points of interest rate increases introduced by Jean Claude Trichet in the summer of 2011).  The weights for energy products (11.4%) and mortgage interest (5.6%) in the CPI basket of goods means that the inflation rate for these combined is equal to 1.8%. 

So what is pushing up the rate of inflation.  Here is table from the CPI Detailed Sub-Indices release with categories that have a CPI weight greater than 0.25% and an annual inflation rate greater than 2.5% (fruit and vegetable juices ‘passed by compensation’ to meet the entry criteria).

CPI Positive

An equivalent table with inflation rates of –2.5% or lower is below the fold.

This time telephone services and other personal effects bounced in off the post (either one) and it can be seen that the total weight of items with in this table of falling prices is one-third less than in the table of rising prices.

CPI Negative

Wednesday, September 12, 2012

Bond Prices Rise

Here is a screen-capture of yesterday’s Daily Outstanding Bonds Report from the NTMA.

Outstanding Bonds 11-09-12

And here is the equivalent from today’s report.

Outstanding Bonds 12-09-12

The price of all Irish government bonds rose today and the associated yields to maturity fell accordingly.  The biggest change seems to have been in the February 2015 bond which rose in price from €104.87 to €106.19 and is now yielding 1.86%.  This is the only inversion, albeit minor, in the yield curve as the January 2014 bond is yielding 1.89%.

On the 26th of July, the NTMA re-launched Ireland’s government bond programme.  Among the steps taken that day a new October 2017 bond was issued.  This had a coupon of 5.5% and on the day the bond sold for €98.27 per €100 unit giving a yield of 5.9%.  As can be seen above the bond is now trading at €106.88 and purchasers at that price are getting a yield of less than 4%. The price of the bond has risen nearly 9% in seven weeks.

Friday, September 7, 2012

Enhanced Conditions Credit Line

Yesterday’s announcements by ECB President, Mario Draghi, brought an additional acronym into mainstream view from the alphabet soup of EU policies and procedures.  This was when he described the features of the new Outright Monetary Transactions and outlined the requirement to have entered a rescue programme before OMTs are undertaken:

Such programmes can take the form of a full EFSF/ESM macroeconomic adjustment programme or a precautionary programme (Enhanced Conditions Credit Line), provided that they include the possibility of EFSF/ESM primary market purchases.

The details of these precautionary programmes are provided in this document from the European Financial Stability Facility (EFSF).

Type of credit lines

1 A precautionary conditioned credit line (PCCL)

Access to a PCCL, which can be drawn as a loan or primary market purchase, is based exclusively on pre-established conditions and is limited to euro area Member States where the economic and financial situation are still fundamentally sound and which remain evidently committed to maintaining sound and credible policies in the future.

A global assessment shall be made on whether a Member State qualifies for PCCL, using as a basis the following criteria:

  • The respect of the SGP commitments. Countries under excessive deficit procedure could still access PCCL, provided they fully abide by the various Council decisions and recommendations aiming at ensuring a smooth and accelerated correction of their excessive deficit.
  • A sustainable public debt.
  • The respect of their EIP commitments. Countries under an excessive imbalance procedure could still access PCCL, provided that they can demonstrate that they are committed to addressing the imbalances identified by the Council.
  • A track record of access to international capital markets on reasonable terms.
  • A sustainable external position.
  • The absence of bank solvency problems that would pose systemic threats to the euro area banking system stability.

The beneficiary Member State shall ensure a continuous respect of the eligibility criteria after the PCCL is granted, to be monitored by the Commission. The PCCL has an initial duration of one year and is renewable twice, for six months each time.

2 An enhanced conditions credit line (ECCL)

Access to an ECCL, which can be drawn by way of a loan, primary market purchase is open to euro area Member States whose general economic and financial situation remains sound, but which do not comply with some of the eligibility criteria required for accessing a PCCL. Accordingly, the Member State concerned shall, after consultation of the Commission and of the ECB, adopt corrective measures aimed at addressing the above mentioned weaknesses and avoiding any future problems with access to market financing, while ensuring a continuous respect of the eligibility criteria which were considered met when the credit line was granted.

The ECCL has an initial duration of one year and is renewable twice, for six months each time. The availability fees charged shall aim at covering fully the costs occurred for the EFSF.

There is also an ECCL with a partial risk protection element.  The section on the ‘enhanced surveillance’ that comes with a precautionary credit line is also noteworthy.  There are no quarterly review missions as occur with full bailout loan programmes.  This is a much lower hurdle for politicians to step over to gain access to the ECB’s support.

Wednesday, September 5, 2012

Is the current budget deficit improving?

At first glance the answer to this question is no as the year-to-August figures for current budget deficit in the Exchequer Account are:

  • 2011: -€8,824 million
  • 2012: -€9,458 million

The Exchequer Account current budget deficit is an important measure of the health of the government finances and the headline figure is a year-on-year deterioration of around €600 million.  However, there has been a number of changes and complications that need to be considered before a useful comparison between the two years can be made.  We have addressed some of these before.

  1. The Sinking Fund Contribution of €646 million has already been made for 2012.  In 2011, this transfer of €683 million from the Current to Capital Account did not take place until November.  A year-on-year comparison is unfair on 2012 because it includes a payment from the current to the capital side of the Exchequer Account that was not made by August of last year.
  2. Last year the debt interest cost for the eight months of the year was €3,031 million, but €577 million of that was paid from the Capital Services Redemption Account with the remaining €2,454 million coming from the Exchequer Account.  In 2012, all the debt interest bill of €4,021 million was paid from the Exchequer Account.
  3. This year’s receipts include €231 million of Corporation Tax which should have been collected in December 2011 but a delay meant it was instead included in the January 2012 receipts.

To account for these we will remove the effect of the Sinking Fund contribution and the delayed Corporation Tax receipts from the 2012 deficit, and add the interest paid from the CSRA to the 2011 deficit.  So we have:

  • 2011: -€8,824 million - €577 million = –€9,401 million
  • 2012: -€9,458 million + €646 million - €231 million = -€9,043 million

On a like-for-like basis the Exchequer current budget deficit is €358 million improved this year.  On a primary basis (excluding debt interest) the improvement is an impressive-sounding €1,348 million.  However, the source of this improvement will not be permanent.

After a number of years of decimating the public finances, the banking measures introduced to rescue the covered banks are now skewing the current budget deficit to make it look temporarily good.  Here are the 2011 and 2012 banking-related revenues in the current account.

  • Central Bank Surplus: €671 million versus €958 million
  • Bank Guarantee Fees: €599 million versus €799 million
  • Contingent Notes Interest: zero versus €300 million

The 2011 banking related revenues contributed €1,270 million to the Exchequer current account; for 2012 the receipts have been €2,057 million.  Receiving more than €3 billion from the banks should not be downplayed but these receipts are not permanent.

The primary current budget deficit is €1,348 million better when compared to 2011, but this is in large part because of a €787 million increase in temporary banking-related revenues meaning the actual improvement is around €561 million .  The primary current deficit is declining (slowly) but this is more than offset by the €990 million increase in debt interest costs.

All told, in the first eight months of 2012 the overall current budget deficit is €429 million bigger than it was last year.

Tuesday, September 4, 2012

Tax Revenue Profiles

While the headline is that “tax take is €365 million ahead of target by end of August” it is useful to go behind the numbers a little bit.  The documents from the Department of Finance are:

Tax revenue is clearly €365 million “ahead of profile”.   It was forecast that €21,711 million of tax would be collected by the end of August.  The outturn is €22,076 million.  However, there are a couple of points to note about the profile.

A revised profile was released on May 2nd to account for delayed Corporation Tax receipts from 2011 and the reclassification of some PRSI receipts as Income Tax that affected the first quarter figures..

As we previously pointed out the revised profile starts with a figure of €8,396 million of tax revenue to the end of March when it was known for a month before the profile was released that €8,722 million of tax had actually been collected in the first three months of the year.  It helps to be “ahead of profile” when you use a profile that is more than €300 million below what you already know has happened.

So how have tax revenues fared in the months since the release of the revised profile.  These are department projections for May, June, July and August and how they compare to the actual outturn.

Tax Forecasts for August 2012

Since the effective tax profile was released on the second of May, tax revenue is €21 million behind expectations.  This is only a shortfall of 0.3% but it can be seen that the total figure is being supported by a €143 million boost from Corporation Tax.  The performance of Income Tax and Excise Duty are significantly below expectations.  Here are the monthly comparisons for total tax revenue.

Monthly Tax Forecasts to August 2012By the end of June tax revenue was more than €500 million “ahead of profile” but about a third of that has been given up in the past two months, with August in particular falling well short.  The DoF documents show that Income Tax and Excise Duty account for most of the shortfall.

Monthly Tax Forecasts August 2012

The relatively good performance in the first six months of the year means that this month’s deterioration is unlikely to threaten the budgetary arithmetic and the end-year target of €36.4 billion.  Tax revenue is “ahead of profile” for the year but the performance is not as strong when limited to the period since the profile was actually released.

It is likely that over the coming months there will be more months where tax revenue is “behind profile”.  This could be a function of the projections as much as it is of tax performance.  This is a by-product of moving more than €300 million of taxes from the actual receipts for January to March to the projections for April to December.   By year-end it is probable that receipts will continue to move from the current €365 million ahead of profile closer to the €36.4 billion annual target.

 
Unsecured Loans Proudly Powered by Blogger