Thursday, January 6, 2011

Understanding the Public Finances is hard

The Irish system of Public Finance is extremely difficult to get a complete handle on.  Here is a 382-page ‘outline’ that explains it all!

The degree of complexity can be seen from the following sentence from the Minster’s press release that was issued with the 2010 Exchequer Accounts yesterday.

While day-to-day spending was marginally ahead of target in the year, this is due to a shortfall in Departmental receipts rather than overruns in spending.

Come again? Spending is up because receipts are down. My head hurts.

Current Account continues to deteriorate

Although the press statement released with the Exchequer Accounts this week indicates that Minister Lenihan believes “that our public finances have stabilised” it is hard to find the reality that ties in with this view.

Here is just one snapshot of the state of our public finances – the balance on the current account (the day-to-day expenses of running central government).

Current Account Balance

The highest ever current budget deficit was recorded in 2010 at €12.6 billion.  The overall exchequer deficit is down from €24.6 billion to €18.7 billion and might grab some headlines.  Graph here.  However, this is entirely due to “savings” on the capital account. 

Capital expenditure was further reduced by about €1 billion in 2010 (projects postponed), and the €4 billion injection into Anglo Irish and €3 billion frontloaded contribution to the NPRF  (for the AIB and BOI recapitalisations) that were part of the 2009 deficit did not occur in 2010. (Or rather there was further bank recapitalisations in 2010 but we have used some accounting magic to keep them off balance sheet.)

The truest barometer of the state of the public finances is the current account deficit.  This is the balance of revenue (primarily tax revenue) against voted current expenditure (wages, pensions, transfer payments, goods and services) and non-voted current expenditure (mainly debt interest).  This does not paint a pretty picture.

  • Tax revenue fell €1, 291 million
  • Voted expenditure rose €261 million
  • Non-Voted expenditure rose €1,468 million

Not much sign of stabilisation here.  The current account would be in continued freefall but was supported be €1,851 million increase in non-tax revenue.  This was mainly down to an increase in the Central Bank Surplus of €415 million and receipts from the institutions covered by the Bank Guarantee Schemes of €1,333 million.  Without these receipts the Current Account Deficit would have been even worse.

2010 Exchequer Returns

The end-of-year Exchequer Returns have been released and we can update our analysis from November.  Also remember that the Exchequer Account is not the Public Finances!

For the full year tax revenue came in at €31.75 billion, ahead of both the Department’s forecast and my own, but still down on the 2009 tax take.

Cumulative Tax Revenue to December

As has been the trend since September the annual rate of decline eased again in December and for the full year tax revenue was €1.3 billion or 3.9% behind last year’s level.  However, when compared to the same month last year, tax revenue in December was just under 1% lower than in December 2009.  This is the first time this comparison has been negative since August.

Monthly Tax Revenues to December

Somewhat worryingly most of the €1.3 billion decline in tax revenue relative to 2009 can be attributed to two of the ‘barometer’ tax headings – Income Tax and VAT.  Both of these for more than €500 million behind their 2009 levels.

Cumulative Tax Revenues to December

Of the four main tax heads, only Corporation Tax came in ahead of the 2009 number and that was by a paltry €24 million.  The picture is not quite so bleak if we do a fourth quarter comparison across the two years.  Q4 tax revenue is actually €242 million ahead of the equivalent 2009 figure.

Quarterly Tax Revenues for Q4 2010

However, this is directly attributable to a 33% surge in Corporation Tax receipts.  Although slightly moderated the decline in Income Tax and VAT continued with no other significant gain outside of Corporation Tax.  But at least it is better than this.

Although December isn’t a hugely significant tax month, accounting for only 7% of annual tax revenue, for completeness we will isolate the monthly figures.

Monthly Tax Revenues December 2010

You can track the performance during the year of the four main tax heads by clicking on the list below.

December was only the second time in 2010 when monthly Income Tax receipts were ahead of their 2009 equivalent.  December is not an important VAT month but monthly receipts were still down over a quarter on 2009.  More important, as can be seen by clicking the link above, VAT receipts in all of the main VAT payment months (Jan, Mar, May, Jul, Sep & Nov) were behind their 2009 equivalents.

The late increase in Corporation Tax receipts meant that December was the first month when the cumulative comparison was positive.  By August Corporation Tax receipts were €582 million behind the amount collected at the same time in 2009.  However, the monthly increases seen in every month since then has meant that this deficit was completely wiped out (even if the swing to positive was only by €24 million).

Excise Duty did not display much volatility.  The monthly comparisons to 2009 were positive for five months and negative for seven, and for the year as a whole Excise Duty was only €24 million or 0.5% behind the 2009 level.  This was likely aided by the introduction the Carbon Tax on different fuels throughout the year and the increase in new car sales throughout the year that would have boosted Vehicle Registration Tax receipts.

Here are the graphs.  Click smaller images to enlarge.

Tax Revenues to December

Income Tax Revenue to December

VAT Revenue to December

Corporation Tax Revenue to December

Excise Duty Revenue to December

Stamp Duty Revenue to December

CGT Revenues to December

Customs Duty Revenues to December

CAT Revenues to December

Monday, December 27, 2010

External Trade: Export Improvement Continues

Just before Christmas the CSO published the September External Trade Release which provides full details of our merchandise trade to September with some preliminary details to October.  Here are our total merchandise exports and imports to October. 

Exports and Imports to November 2010

Although both exports and imports fell in the month to October, the  figures do little to belie the perception that Irish goods exports have shown remarkable resilience during the current crisis with imports falling significantly.  In October, in seasonally adjusted terms, exports fell 1.9% and imports fell by 11.2%.

This resulted in a further widening of the trade surplus.

Trade Surplus to November 2010

The seasonally adjusted trade balance for October was a record €4.153 billion.  It should be noted that this increase in the trade balance is a result of the drop in imports rather than an increase in exports.

On the export side the importance of medical and pharmaceutical products remains.  We now have the breakdown of exports by category to September.  Here are medical and pharmaceutical products exports.

Pharmaceutical Exports to September 2010

Exports in this category have increased to an average around €2 billion a month in 2010, up around 66% from the average of €1.2 billion a month seen in 2007.  Medical and pharmaceutical products now make up around one-quarter of total Irish merchandise exports.
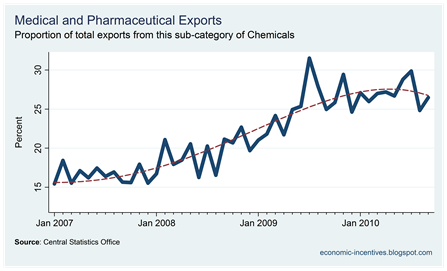
Proportion of Exports from Pharmaceuticals

In fact, total exports in NACE Category 5 chemicals are now around €4.5 billion a month and make up nearly 60% of total goods exports from Ireland.  Graphs of the amount and proportion of exports from this category are behind the links.  Here we see the proportion of exports from all ten main NACE categories.  Click graph to enlarge.
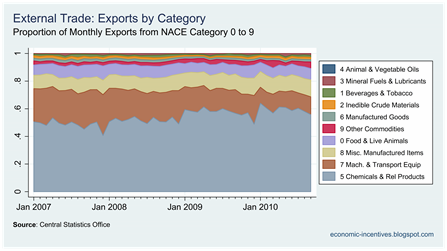
Exports by Category Proportions

The dominance of ‘Chemicals and Related Products’ is visibly clear and outside of ‘Food and Live Animals’, ‘Miscellaneous Manufactured Goods’ and ‘Machinery and Transport Equipment’ the remaining categories are largely insignificant.

Next we consider the performance our merchandise exports excluding the high value chemicals sector.

Exports excluding Chemicals to September 2010

Outside of Chemicals, Irish exports dropped markedly during 2007, 2008 and 2009.  The performance of Irish exports in the recession has been masked by the strong performance in the Chemicals category, and in particular in the Medicine and Pharmaceuticals sub-category. 

It must be noted that there has been something of a turnaround in 2010 and in September these exports recorded their highest monthly level since October 2008.   In fact, if we consider the Balance of Trade for all goods except NACE Category 5 Chemical and Related Products we see that the rest of the economy is moving to surplus after a persistent deficit.

Trade Balance excluding Chemicals

Here are the trade balances broken down by the main NACE categories.

Trade Balance by Category

Excluding Chemicals there is only a trade surplus of €127 million.  However this is a turnaround from the deficit of €1.4 billion recorded to the same time last year.  As with the improvement in the overall trade balance the increase in the trade balance excluding chemicals is down to a fall in imports but for 2010 there also has been a general increase in exports.  The following table shows how all export categories have been performing this year.  It is a good news table!

Exports by Category to September

In the first nine months of the year exports are ahead of 2009 levels in all categories except Machinery and Transport Equipment.  For the same period exports are now only 0.5% behind the peak recorded in 2007, though this is mainly due to the 20% increase in the Chemicals and Related Products category in that time.  Most of the other main categories are showing double-digit declines on their 2007 levels.  See table here.

Although several categories are down on their 2007 levels the main drag on Irish exports over the past four years has been the ‘Machinery and Transport Equipment’ category.  Exports in this category have fallen by almost 50%, and are almost €1 billion a month lower than they were at the start of 2007.

Machinery and Transport Equip Exports to September 2010

Although there are several sub-categories in this group most of the decline can be attributed to the collapse in the exports in the ‘Office Machines and Automatic Data Processing Machines’ (i.e. computers) sub-category.  Exports in this category have fallen by almost 65%.

Computer Exports to September 2010

Thursday, December 23, 2010

Retail Sales slip again

Although we are right up to Christmas the CSO are still releasing data.  Today we got the first estimates of the November Retail Sales Index.  The all-business index is showing some stability but as is usual we will focus on the retail sales index excluding the motor trades.

In November the motor trades make up 14% of the index.  Here are the value and volume indices for the remaining 86% since January 2008.  The  most recent trend is down, particularly for the value index.  The gap between the two indices continues to grow, reflecting the deflationary pressures that still persist in many retail sectors and a greater “value for money” drive among consumers.

Ex Motor Trades Index to Nov

The value of sales fell by 0.4% in the month, with volume declining 0.2%.  This index has not shown any sign of increases since April.  The only positive monthly changes recorded since then were in August and they were only just above zero.

Monthly Change Ex Motor Trade Index to Nov

After edging towards positive territory for the past few months the annual changes took a slight dive in November.  By value sales are now 1.9% behind last year with a decline of 0.9% in the volume index.

Annual Change Ex Motor Trade Index to Nov

The retail sales index rose in the early part of the year to April.  However, since then the downward trend has resumed.  In the last six months the value index of retail sales excluding the motor trades is down 4.8% with volume down 2.4%.

The National Accounts might indicate that the economy is growing but this is entirely an export-driven trend.  The domestic economy continues to deteriorate.  The recent inclement weather is likely to further damage retail sales, though shoppers may come out in force in January. 

However, with tax increases and benefit cuts soon to come into force we can expect retail sales to continue to struggle.  In particular, the annual growth rates will deteriorate further as the comparison will be made to the short-lived “turning the corner” momentum of the early months of 2010.

Tuesday, December 21, 2010

Employment and Unemployment

We know that Ireland currently has 299,000 people classified as unemployed by the CSO.  This is an increase of nearly 200,000 since the peak of employment was achieved in the middle of 2007.  However, in the fall from this peak the number of people in employment has fallen by nearly 300,000.

Our unemployment figures understate the destruction of jobs in the economy by almost 100,000.  A lot of people have left the ranks of the employed but have not added to the numbers unemployed.  This gap is substantial.

All Cumulative Changes

This gap have significant consequences.  It gives a lower unemployment rate than might otherwise be the case.  It ‘saves’ the government substantial social welfare payments which it would otherwise have to meet.

Where did these 100,000 people go?

About 1/4 of the answer is to be found in the changes to the numbers for Irish Nationals.  The gap for Irish nationals is likely a combination of a number of factors

  • people leaving the labour force or reaching retirement age
  • people continuing or returning to education
  • people emigrating

Irish Cumulative Changes

The remaining 3/4 can be see if we look at non-Irish nationals and it is likely that most of this is down to people leaving the country.

Non-Irish Cumulative Changes

The numbers of non-Irish nationals who are classified as unemployed is essentially unchanged since the start of 2009 even as the number employed has continued to fall relatively unabated.

Who’s unemployed

A lot of time is spent looking at unemployment rates, here we just look at the numbers.  According to the latest QNHS there are now 299,000 people unemployed in Ireland.  The decrease in the numbers seen during the short-lived ‘turning the corner’ period at the end of 2010 has been replaced by a consistent increase during 2010.

Total Unemployed

Who are these 299,000 people?

According to the CSO data 248,900 are Irish nationals and 50,100 are non-Irish nationals. 201,500 are male and 97,500 are female.  Since the start of 2007 the number of males unemployed has risen by 233%, with a 160% rise in the number of females unemployed.

Total Unemployed by Gender

If we look at the current figure of 299,00 we can break it down by age as well as gender.

Q3 2010 Unemployment by Age and Gender

Although for both genders the numbers in the younger age categories are the largest, these categories have seen a reduction in the numbers unemployed recently (perhaps as people in these categories return to education or leave the country) while the numbers unemployed are the older age categories is continuing to rise. Click to enlarge.

Numbers Unemployed by Age

Finally, for now here is the region breakdown of the 299,000 unemployed.

Q3 2010 Unemployment by Region

 
Unsecured Loans Proudly Powered by Blogger