Monday, January 28, 2013

Where was the Xmas “surge” in Retail Sales?

The CSO have released the December 2012 Retail Sales Index.  There is something missing from the data – the much heralded “surge” in retail sales that apparently took place around the Christmas period.  Here is the core retail sales index which excludes the Motor Trades.

Ex Motor Trades Index to November 2012

There was an increase in December but only marginally.  The trend in retail sales is up but this data do not reflect what was feted as “the best Christmas for retailers since 2007”.  Here it might be a little instructive to use the unadjusted series that just looks at the amount of retail sales without taking seasonal factors into account.  This chart has the unadjusted series for core retail sales (with December 2008 equal to 100).

Unadjusted Ex Motor Trades Index to December 2012

Unsurprisingly there is a spike in retail sales each December.  At 94.2, this year’s December peak was higher than each of the last two years (92.5 in 2010 and 93.3 in 2011 using the base in the chart) but was below both 2008 (100) and 2009 (94.7).

Maybe we are not looking in the right place.  It would be great if the CSO provided a resource that allowed us to create selected sub-indices from the categories provided.  The retail sales shown in the above charts include fuel, furniture, hardware, medicines and other categories which were likely excluded when Retail Excellence Ireland were making their seasonal claims.  These items only make up about one-fifth of the indices shown above so their effect is unlikely to be significant.

Although limited we can use one of the indices to check for the retail surge.  Non-food sales in Department Stores are only about 1/12th of the above indices but might be expected to reflect the broader pattern in Christmas shopping.  Here are the unadjusted series.

Unadjusted Department Stores to December 2012

That seems more like it.  The volume of non-food sales in Department Stores in December 2012 was indeed the highest since 2007.  In fact, volume was nearly 20% higher than 2008.  However, the value index was identical.  See here.  The adjusted series also shows a jump last month.

Unadjusted Department Stores to December 2012

And this also shows that the trend in sales in Department Stores has been positive since about April of last year.  However, apart from Department Stores it is hard to find evidence of the Christmas surge.  Sales in bars did jump 5% in December but the underlying trend in this sector is unmistakeable.

Aadjusted Bar Sales to December 2012

The retails sales of electrical goods (computers and peripherals, televisions, radios and DVD players, games consoles and software and telecommunications equipment) has been positive in recent months (in volume terms at least). 

Adjusted Electrical Goods Sales to December 2012

The recent jump was due to the digital switchover in October rather than any pre-Xmas exuberance.  Even still, the volume in this category in December was up 4% on last year, though the value of sales was down by around 1%.

It looks like the warning at the end of this post that “the plural of anecdote is not data” is borne out by the above data.

Monday, January 21, 2013

Debt and Deficits Decomposed

A new dataset from Eurostat has received a lot of attention recently as it highlights the deficit costs of the bailout of our banking system that began with the blanket guarantee of September 2008.  On the other side of the same coin the data allows us to determine the non-banking crisis element of our recent deficits.

The following table shows the €105 billion of general government deficits that were accumulated between 2008 and 2011.  According to the Eurostat data €41 billion of these was due to measures introduced to deal with the banking collapse.  The final section of the table gives the ‘underlying’ deficit which is simply calculated as the difference between the total and banking-related figures in the sections above it.

Banking and Underlying Deficits

Between 2008 and 2011 the ‘underlying’ deficits totalled €64 billion and this is a running total as the deficits continue to accumulate. 

At the end of 2007, the gross general government debt was just over €47 billion.  2007 was the last year when the general government accounts were close to balance and a small surplus of €143 million was recorded.

Since the end of 2007, the debt has ballooned and by the end of 2012 it is estimated to be around €190 billion.  The increase can be broken down as follows:

Debt Changes 2008 to 2012

The figure for the 2012 general government deficit will be finalised later in the year and is likely to come around €13 billion.  With guarantee fees, interest on contingent capital notes, dividends on preference shares it is also likely that the revenues from the banking measures will exceed the expenditures. 

The surplus income paid to the Exchequer from the Central Bank has increased significantly in recent years (2008: €290 million; 2012: €958 million).  The increase is mainly as a result of profits made by the Central Bank on the Exceptional Liquidity Assistance it is provided to Anglo/INBS.  This is not included in the ‘banking’ revenues measured by Eurostat.

The stock/flow adjustment is mainly the increase in cash balances held by the NTMA from €4.4 billion at the end of 2007 to €24.0 billion at the end of 2012.

Just over one-fifth of the 2012 debt is due to the banks though the full cost of the bank bailout is larger when non-deficit increasing expenditures are included.  This includes the value of the some of the funds depleted from the National Pension Reserve Fund to buy ordinary and preference shares in AIB and BOI. It also includes the expenditure by the Exchequer on shares in PTSB and Irish Life and the contingent capital notes remaining in AIB and PTSB.  

Nearly two-thirds of the debt has been accumulated because of deficit spending by the government sector.

The 2007 debt accounts for 25% of the current total and that was the legacy of the last incident of national insolvency in the 1980s. The debt that resulted from the accumulated deficits of the time were simply rolled over and never repaid.  Growth and inflation meant the debt burden fell from 120% of GDP in the late 80s to 25% of GDP by 2007. 

The ongoing deficits since 2008 have contributed around 40% of the current debt mountain but the nature of them is changing as we move closer to a primary budget balance.

Friday, January 18, 2013

Patrick Honohan on ELA

The exchanges in this week’s Joint Oireachtas Committee on Finance at which Governor of the Central Bank, Prof. Patrick Honohan attended as a witness provided some useful insights into to Promissory Note/Exceptional Liquidity Assistance arrangement used to prop up Anglo Irish Bank and the Irish Nationwide Building Society.  

Most of the details of the arrangement were generally known but some confirmation of them was provided by Prof. Honohan.  These are from the transcript.

1. The money is owed to the ECB.

Patrick Honohan: “Two years ago on 30 March 2011, some €3 billion was handed back to the Central Bank. The Government paid some €3.1 billion in cash to the IBRC. The IBRC is already borrowing and I cannot remember how much it had borrowed at that stage. It would then repay the Central Bank of Ireland, which has drawn on facilities in the ECB. Our drawing on the ECB facilities, in other words the money we owe to the European Central Bank as a whole, will decline by that amount.”

1b. Patrick Honohan owes it to the ECB!

Patrick Honohan: “I am the chief executive officer of the Central Bank and I owe that money. I am personally responsible for making sure that debt is repaid.”

2. Default on the ELA would be “uncomfortable” in some undefined way.

Patrick Honohan: “A unilateral action of the type Deputy Humphreys is talking about would be taken very poorly indeed by the ECB, which – without over-egging the case – has provided a lot of finance to this country at a low interest rate. There are a number of ways the European Central Bank, if it chose, could find to make things uncomfortable in a graduated way. It is not in that space but I have to think what it might do. It could do things that would make us uncomfortable. I will not give a list because it might give people ideas.”

“Large sums of money are being lent by the ECB to various Irish institutions and very low interest rates are being applied. All of that could change if the ECB wanted, but I do not say it would. The reaction of the international markets would also be of concern. I am too much of an academic and I take up the question when I should probably have said it is unthinkable and that I could not possibly imagine such a case. If the Deputy wants to go through it blow by blow, the blows would be unpleasant.”

2b. But the ATMs will stay open!

Patrick Honohan: “I will not describe on television some dramatic situation and give a one-liner such as that ATMs would be closed. ATMs would not be closed, but it is not as if one can decide not to give the money and use it oneself. There are consequences. There is a network of international contracts and lenders who will take action against the Government and we have seen it.”

3. The interest rate charged on the ELA is 2.50% (ECB + 1.75 percentage points)

Patrick Honohan: “I am afraid of getting this wrong but as far as I recall, the IBRC currently pays 2.25%.” [Subsequently amended to 2.50%]

4. The interest rate payable by the Central Bank for the facility is 0.75% (ECB MRO rate)

Patrick Honohan: It is at 75 basis points.

Nobody in the session mentioned the interest rate being paid by the Exchequer to the 100% state-owned IBRC so maybe it has sunk in that it doesn’t really matter.  Of the interest rates in the PN/ELA arrangement the one that counts is the 0.75% paid by the Central Bank to the ECB.

There was also some useful information (or at least the non-rebuttal of some information) on the ECB’s holdings of Irish government bonds through the now-defunct Securities Market Programme (SMP) which is below the fold.

Deputy Kevin Humphreys:  “The ECB purchased significant amounts of distressed euro sovereign debt in the secondary bond market in 2010 and 2011 through the security market programme. I understand that approximately €200 billion worth of bonds are being held to maturity. It is estimated that between €15 billion and €20 billion of Irish bonds were bought, mostly at distressed prices well below par.

The Barclays Capital report of January 2012 stated that about €19 billion of Irish Government bonds were being held by the ECB. Is that the correct sum?

We heard a lot about how Franklin Templeton made huge returns by buying Irish bonds at low prices. It is difficult to estimate the profits the ECB will make on the capital proportion of these bonds bought through the SMP but it could be in the range of €3 billion to €5 billion. The problem is, and I asked about this in private session before and was given short shrift, we do not know what the ECB profits may be because the ECB will not tell us. The Governor sits on the board, however, so does he know and will he tell us?”

Patrick Honohan:  “I know how much Irish paper is held by the ECB in the security market programme. I could try to calculate the profits.”

Kevin Humphreys:  “Am I far off in my calculations?”

Patrick Honohan: “I would steer the Deputy away if I thought he was. I think that more information about the SMP holdings will be provided. The SMP has terminated as a programme and the reasons of market sensitivity that caused it not to be disclosed would fade away. At present, however, I am not at liberty to give out those numbers.”

Tuesday, January 15, 2013

Is Ireland low-tax? Again!

Over on Notesonthefront there is a post which contains the following:

As seen, Irish high-income earners are taxed at relatively low-rates.  We’re right down there with other peripheral countries (with the exception of Italy) and low-tax, high-poverty UK.

The accompanying chart in the post purports to support the claim but is a little wide of the mark.  High-income earners are not taxed at relatively low rates in Ireland.  Here is the same chart for the EU15 but breaking  income deductions into Income Tax and Social Contributions, and ranking them by effective income tax rates.

Tax and Social Insurance

All data is 2010, except for Ireland which is 2011.  Of the EU15, Ireland has the 6th highest effective rate of Income Tax on a double-income no-child couple earning 200% and 167% of the average wage (as determined by the OECD).   The arithmetic average of the effective tax rate on this group across the EU15 is 27.1%, 2.8 percentage points below the effective rate in Ireland.

The same chart ordered by employee Social Insurance contributions presents a different picture.

Tax and Social Insurance 2

Ireland is last among the EU15 when it comes to employee social insurance contributions.  For high-earners, Ireland is an above-average taxed, low-social insured economy.  A chart ranked by total deductions is here.

The OECD tax-benefits calculator used in the linked post allows us to determine what happens when the couple above lose the income of the person earning twice the average wage.  The chart below shows the percentage of their original net pay the couple will have from claiming unemployment benefit during the first month of unemployment, what is known as the replacement rate.

Net Pay

All data is 2010.  In Ireland, the loss of income would see the couple drop to 59% of their previous net pay.  This is the third lowest in the EU15.  Ireland has low social insurance contributions on high earners and in return high earners get (relatively) low social insurance benefits against unemployment.

What happens if we repeat the first chart but instead use a single-income no-child couple with that income equal to the average wage?

Tax and Social Insurance 3

Ireland, which has the sixth highest effective income tax rate on the “high-income” couple, drops to 12th place when it comes to the effective income tax rate on the “average-income” couple.  The arithmetic average for the EU15 is 14.0% which is greater than the 9.6% levied in Ireland.  If we rank the above chart by social insurance contributions we get:

 Tax and Social Insurance 4

For average earners Ireland is a low-taxed, low-social-insured economy.  A chart ranked by total deductions is here.   Ireland is at the bottom.

And what happens to the “average” income couple should they lose this income?  Here is the net income compared to the original income in the first month after becoming unemployed (the replacement rate).

Net Pay 2

The Irish single-income couple earning 100% of the average wage makes the lowest social insurance contributions in the EU.  However, if they lose that income in the first month of availing of unemployment benefit their net income drops to 78.1% of the previous income.  This is the second lowest drop in the EU15.

So for a “high-income” no-child couple (200% & 167% of the average wage) Ireland has (Ireland versus EU15 mean):

  • the sixth highest effective income tax rate in the EU15
    • 29.7% versus 27.1%,
  • the lowest rate of employee social insurance contributions in the EU15
    • 3.6% versus 10.1%,
  • the 13th highest replacement rate after the loss of the first income in the EU15
    • 59.1% versus 68.5%.

And for an “average-income” no-child couple (single income at 100% of the average wage) Ireland has:

  • the 12th highest effective income tax rate in the EU15
    • 9.6% versus 14.0%,
  • the lowest rate of employee social insurance contributions in the EU15
    • 3.2% versus 11.9%,
  • the second highest replacement rate in the EU15.
    • 78.1% versus 63.9% .

All data (bar Ireland 2011 data where appropriate) are derived from the OCED’s tax-benefit calculator and is posted below the fold.

First here are the details for the double-income no-child couple with incomes of 200% and 167% of the average wage.  The first net income refers to when both incomes are earned.  The second net income shows the position one month after the loss of the larger income. Click to enlarge.  All data is 2010 except IRE* which is 2011.

High Income Couple

And here are the details for a single-income no-child couple with an income equal to 100% of the average wage.  Again click to enlarge.

Average Income Couple

Monday, January 14, 2013

Savings Confusion and an Investment Collapse

It has been a confusing day for reports on the savings behaviour of Irish households.  One story on the Irish Times site tells us that:

The savings index fell from 98 to 81 in December, the lowest ever level since the index's inception in April 2010, as increased negative sentiment towards the economic environment discouraged saving.

While another story posted to the same site says:

The institutional sector accounts, which brings together information on the activities of households, businesses and the Government, show that the gross amount of household savings was €11.92 billion for the first three quarters of 2012. This is more than the €9.3 billion of total savings recorded during 2011.

The derived gross savings ratio increased by 14.5 per cent in the second quarter to 16 per cent in the third quarter last year. This ratio expresses household savings as a percentage of gross disposable household income.

Of course, the Savings Index from Nationwide UK (Ireland) and the Institutional Sector Accounts from the Central Statistics Office are dealing with very different meanings of the term ‘saving’.  The focus here is on the measure produced by the CSO which relates to the gap between disposable income and consumption expenditure and is shown in the following chart.  The savings rate is the percentage of gross disposable income (plus an adjustment for pension funds) that is not spent on consumption.

SA Household Savings Rate

It is often suggested that the current rate is somehow “too high”.  A recent Irish Examiner report states that:

At a press briefing to announce the end-of-year exchequer figures on Thursday, Finance Minister Michael Noonan said that the national savings rate was now 14%, compared with 1.5% during the Celtic Tiger years. If people spent more and brought the savings rate down to 10%, then it would add 1% to growth, the minister said.

Is Ireland’s savings rate “too high”?  The Q2 2012 figure shown in the above chart is 14.5%.  Eurostat figures show that the EZ17 figure for the same quarter was 12.9%.  In fact, after going above the EZ17 rate  for the first time in Q1 2009 the Irish savings rate was below the EZ17 average for the next three years.  It is only in Q2 2012 that the rate has exceeded the EZ17 average.

EZ SA Household Savings Rate

While the Irish household savings rate has shown some volatility over the past decade, the most dramatic changes in household behaviour have not been to do with savings but to do with capital formation (investment in non-financial assets).  In national accounts, household investment mainly consists of the purchase of new dwellings and the renovation of existing dwellings. 

Household Savings and Investment Rates

Household investment has gone from close to 30% of gross household disposable income in 2006 to less than 5% now.  Again the comparison to the EZ17 average is revealing.

EZ Household Investment Rate

Compared to the EZ17 average, the household investment rate in Ireland has gone from being significantly “too high”, to what seems to be a small bit “too low”.  The household investment rate fell dramatically from 2007-2009 and has continued to fall, albeit more slowly, since then.  By Q3 2012, the household investment rate in Ireland had dropped to a low of 3.6% of gross disposable income.  The EZ17 average is around 9%.

The gross investment rate of households is defined as gross fixed capital formation divided by gross disposable income, with the latter being adjusted for the change in the net equity of households in pension funds reserves.

In the first three quarters of 2006, the household sector in Ireland invested €19.5 billion in gross capital formation in non-financial assets (mainly buying new houses but also paying stamp duty on second-hand houses).  For the first three quarters of 2012, the equivalent figure is €3.8 billion, a drop of more than 80% from the peak. 

If the EZ17 average of a 9% household investment rate applied in Ireland then the 2012 figure for the first three quarters would be €6.2 billion.  The quote from Michael Noonan above shows that he thinks that reducing the savings rate to 10% (below the EZ17 average) would add 1% to GDP growth.  However, if the household investment rate rose to 9% (just equal to the EZ average) it would add 2% to GDP growth.

Where is this saving going?  Excluding the adjustment for pension funds the household sector “saved” €31 billion in the two and a half years from the start of 2009.  As it wasn’t used to fund consumption where did this €31 billion go?

The Central Bank produces quarterly financial accounts which show the changes in the financial position of the household sector.  For the household sector, the key measures are currency and deposit assets and loan liabilities.

Household Deposits and Loans

Since the end of 2008 the currency and deposit asset of the Irish household sector has hardly moved.  It was €120 billion in Q4 2008 and was €124 billion in Q2 2012.  Over the same period the loan liabilities of the household sector declined from €204 billion to €180 billion.

Since 2009, Irish households have not used €31 billion of their disposable income to fund consumption expenditure.  In the main this unspent money has been used to pay down debt rather than accumulate deposits.  The Nationwide UK (Ireland) survey shows that Irish households are not building up “savings”; the CSO data clearly show that Irish households are “saving” but that this is going to pay down debt.

The Irish background data used above in the non-financial charts and some additional comments are below the fold.

First, the components of Gross Household Disposable Income which is the sum of wages, self employed earnings/mixed income, property income and social transfers less taxes on income and wealth.  Click to enlarge.
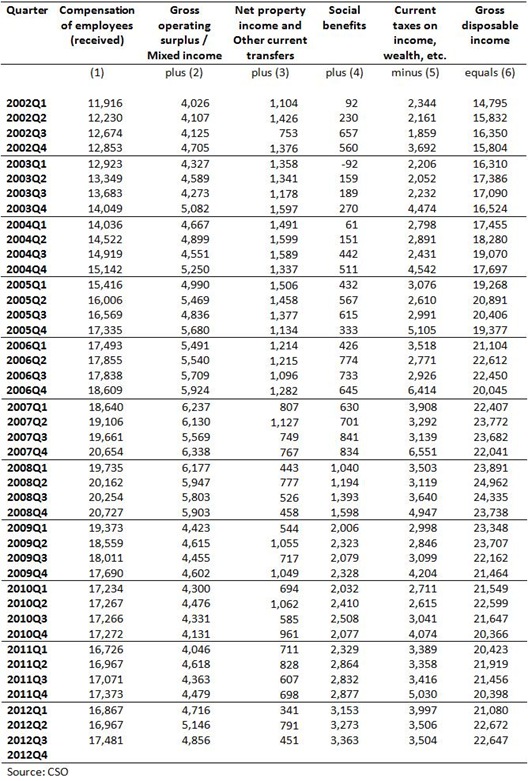
Household Accounts (1)

For the first three quarters of 2012, gross household disposable income was €66.4 billion, which is a 4.1% increase on the €63.8 billion recorded for 2011.  This increase in income is not reflected in household consumption expenditure which continues to flat-line.

Household Consumption and Investment

The factors giving rise to the increase in gross disposable income are in the following table (all in €millions).

Gross Disposable Income

Wages received, non-wage earnings and mixed income, and social benefits all contributed to the increase in gross disposable income over the year.  Offsetting factors were the reduction in net property income (mainly interest) and the increase in taxes on income and wealth.

Compared to the peak in 2008, gross household disposable income has fallen 9.3%.  Over the same period there has been an estimated 2.2% increase in the population (4,485,100 to 4,585,400) so the fall in per capita income is even greater. 

And here are the consumption, savings and investment figures.  The savings and investment rates in the final two columns are four-quarter moving-averages. Click to enlarge.

Household Accounts (2)

Although the first table shows some positive signs with the recent rise in gross household disposable income there aren’t even hints of so-called green shoots from the household sector in the data in the second table – consumption expenditure is moribund and household investment continues to fall. 

There were anecdotal claims that retail sales during the Christmas period and January sales were ahead of expectations.  As “the plural of anecdote is not data we will wait until the final column in the above table is filled in before drawing actual conclusions.

Wednesday, January 9, 2013

€14 billion in Bank Assets

Today’s sale of a €1 billion contingent convertible capital note (a form of subordinated bond) in Bank of Ireland brings the assets the State holds in the banks into focus.

There is another €1.6 billion of these bonds held from AIB and €0.4 billion from PTSB.  The NPRF holds the State’s preference and ordinary shares in AIB and BOI.  These are currently valued at €8.6 billion.  The Minister for Finance holds the State’s 99.75% holding in PTSB but no value is put on this.  The same goes for Irish Life which it is hoped can be sold for €1.3 billion.

All told, the State probably has about €14 billion of remaining assets in the ‘viable’ banks.

  • €2 billion contingent convertible notes in AIB and PTSB
  • €8.6 billion of preference and ordinary shares in AIB and BOI
  • €1.3 billion through ownership of Irish Life
  • 99.75% shareholding in PTSB

These valuations for AIB and PTSB are questionable as BOI is the only bank the State has been able to sell anything from.  Still it is better to be seeing the banks as vehicles for reducing our government debt levels rather than sinkholes to increase it, not that that problem has completely gone away.

Monday, January 7, 2013

Irish Examiner 04/01/13

The unedited text of a recent article from The Irish Examiner is continued below the fold while the published version can be read here.

Lower paid would be hit if State were to raise taxes

Friday, January 04, 2013

Ireland is not a low-income tax economy and collects more income tax relative to the size of the economy compared to many of our EU peers. There have been many calls to raise income tax in Ireland to levels in other countries. What these suggestions fail to acknowledge is how these countries raise more income tax than us. They do so by levying significantly more taxes on low and middle incomes than we do.

It is a common refrain that Ireland is a low-tax economy. This is not true. In 2011, the EU average for tax receipts as a percentage of gross domestic product (GDP) was 26%. The figure in Ireland was 24%, and using gross national product (GNP), which may be a more appropriate measure for Ireland, the figure is 28%. Ireland does not collect a low amount of taxes.

Where government revenue in Ireland does fall short is for social insurance contributions. Ireland’s only social contribution is pay-related social insurance (PRSI). Although there are different classes the typical rates are 4% of gross salary for employee contributions and an additional 10.75% of gross salary for employer contributions. PRSI contributions were equal to 5% of GDP in 2011. The EU average for social contributions was 13% of GDP.

PRSI contributions are paid into the Social Insurance Fund (SIF) and these are expected to be around €7,100 million in 2013. Claims on the SIF are expected to be €8,600 million.

The main expenditures of the SIF are the contributory state pensions which will cost around €5,500 million in 2013. There will be around €1,100 million of supports to those in the labour market such as Jobseeker’s Benefit, Maternity Benefit and Redundancy Payments, while around €1,500 million of supports will be provided under Illness and Disability Benefits.

There is a deficit of around 1% of GDP in the Social Insurance Fund but this is only a portion of the 7.5% of GDP deficit we will run next year. The main reason for the deficit is that tax-funded expenditures exceed tax revenue.

Personal income tax revenue in Ireland as a percent of GDP is the eighth highest of the 27 countries in the EU. Ireland is not a low income tax country and collects the equivalent of nine percent of GDP in income tax. In 2011, Eurostat reported that there was €14.2 billion of personal income tax collected in Ireland with GDP of €156 billion. This level is more than Germany, France, Spain and the Netherlands.

There are six countries in the EU that collect more than ten percent of GDP in personal income taxes. Unsurprisingly, these include the Scandinavian countries Denmark, Sweden and Finland, as well as Belgium, Italy and the UK.

Ireland has to close the largest budget deficit in the EU. There are many who argue that the gap should be closed with more tax increases, particularly income tax increases on the rich. The coalition government have made a commitment not to increase income tax but arguments are made that raising income tax revenues to more than 10 percent of GDP would help close more of the deficit.

This is true and the argument generally moves to a claim that we should increase income tax on 'high earners'. The argument usually stops there and what is rarely presented is how those countries who collect more income tax than Ireland achieve it. There are no proposals that we should introduce a particular country’s tax system in order to meet this objective of collecting more income tax from high earners.

So how do the countries generating more than 10 percent of GDP from income tax achieve it? Research from the OECD allows us to compare the effective income tax rates at different incomes: below average income, at the average income and above the average income. In Ireland, this income levels are €22,000, €33,000 and €55,000.

At present, in Ireland if these incomes are earned by a single person with no children they will face an income tax plus universal social charge bill of €2,000, €5,000 and €15,000. Ireland has a progressive tax system. Through the income levels used the effective tax rate rises from 9% to 15% to 28%.

At the same relative income levels the average effective income tax rates in the six 'high-tax' countries go from 18% to 22% to 30%.

There would be an increase in income tax at all levels. What is noteworthy is where the tax burden falls. Below average earners would see their income tax bill double, while above average earners would see their tax bill rise by around one-twelfth. These tax increases would cost someone on €22,000 around €2,000 a year while someone on €55,000 would just pay an extra €1,000 in tax.

High-tax countries do not have higher rates of income tax on higher earners than Ireland. The high-tax countries raise more tax revenue by levying more tax on average incomes and substantially more tax on lower earners than is presently the case in Ireland.

Ireland has the most progressive tax system in the EU. Irish income tax is above the EU average for high incomes and below the EU average for low and middle incomes.

If we are to align our income tax revenue with high-tax countries there appears little scope to raise additional revenue from high earners. To narrow the gap in the manner they raise tax we would have to substantially raise taxation on average and below-average incomes. Somehow I don't think that's what many of those who say we should be more like Denmark, Sweden and Finland.

 
Unsecured Loans Proudly Powered by Blogger