Tuesday, December 22, 2009

Earnings data: change or no change?

The CSO have published their latest release of the Earnings Hours and Employment Costs Survey (EHECS). The data give an insight into employment numbers and average earnings across the Irish economy. The survey began in Q1 2008 and replaces a number of sector surveys ran by the CSO.

The simplest comparison is between average weekly earnings in the public and private sectors as shown in the following graph.

For the six quarters available there seems to be a slight upward trend in public sector wages (up 4.2% since Q1 2008) with a slight downward trend in private sector wages (down 4.0%). Note though that these are gross earnings that do not take account of the public sector pension levy introduced in April 2009. Looking at more disaggregated data. Click to enlarge.

It is clear that despite much media coverage and enecdotal evidence that average weekly wages are not falling rapidly. For the year to Q2 2009 weekly earnings are down only 1.1% (public sector +1.3%, private sector -3.1%)

The sectors that shows the biggest annual falls are finance, insurance and real estate (-13.3%), transportation and storage (-3.5%) and professional, scientific and technical (-1.8%). The biggest increases were in education (+1.0%), public administration and defence (+0.7%) and industry (0.6%).

However it is important to note that these wage measures are not calculated with a weighted index like the CPI but is simply the total wage bill divided by the numbers employed. As John Fitzgerald points out:

These data are designed to give us good information on the wage bill. They are not well designed to give us information on pay rates.

The data on average hourly earnings and average weekly earnings are generated by aggregating the wage bill for a sector and dividing through by the total employment or total hours worked. With most of the loss of employment being among the lower paid “production, transport, craft and other manual” category this shows up as an increase in average earnings, even if there is no change in pay rates. This biases upwards the figures significantly.

This problem could be ameliorated by creating an index where the changes in each individual category were weighted by the wage bill for that category.
If we turn to the numbers employed in each sector. Again click to enlarge.


Here we see some far stronger trends. The biggest annual drops in the number of employees are construction (-19.5%), administrative and support (-13.9%), information and communication (-12.5%), industry (-9.8%) and accommodaton and food service (-9.1%). The only sectors to see an increase in employment are education (+1.0%) and human health and social work (+2.2%)

By combining the average earnings with the numbers of employees we can get an insight into the wage bill in different sectors. Returning to the crude public/private comparison.

This suggests that the public sector earnings have been relatively constant (annual change +0.07%) while aggregate earnings in the private sector have fallen (-10.7%). Again it should be noted that the public sector figures exclude the pension levy and it will be the Q1 2010 data before the paycuts announced in the recent Budget will be seen. If we move to the data by sector.

It is clear that total earnings in many private sector parts of the economy have fallen quiet significantly. Construction (-20.5), financial, insurance and real estate (-15.9%), administrative and support (-14.4%) and information and communication (-12.1%) say the biggest increases with education (+2.1%) and health and social work (+2.5%) the only sectors to see an annual increase in total earnings. These are parts of the economy dominated by public sector provision.

The conclusion is that there have been some mild falls in average gross earnings but the financial, insurance and real estate sector aside these have been insignificant. Although not shown there have been drops in net pay in the public sector as a result of the pension levy. There will also be a drop in gross pay in Q1 2010. These drops in average earnings have generally not been evident in the private sector.

The biggest impact on pay and earnings in the private sector has been through decreases in the number of employees with large drops across a range of areas. Numbers in the public sector have shown only small decreases but earnings have been reduced through cuts in net earnings.

The Blame Game

The Consultative Consumer Panel published their Submission on the Performance Review of the Financial Regulator 2008/2009. The 12-page report can be read here. It is a "hard hitting" report but that takes aim at the performance of the Financial Regulator and it's now departed Chief Executive, Pat Neary. Mr. Neary, it seems, is the one to blame for virtually all the ills in the economy. The report states:

The Financial Regulator's failure to ensure sound financial services providers has hurt consumers hard. They have suffered from negative equity on their homes, falling share prices, poorer returns on pension funds and the lack of availability of credit. The cost of bailing out the banking system has contributed to rising unemployment, wage and social welfare cuts and higher tax rates. Those negative effects have been only partially offset by lower mortgage rates, adjusted asset prices and higher deposit rates.
Is your home in negative equity? It's Pat Neary's fault.
Has your investment portfolio or pension fallen in value. It's Pat Neary's fault.
Are you finding it difficult to get a loan. It's Pat Neary's fault.
Have you lost your job? It's Pat Neary's fault.
Has you Social Welfare been cut? It's Pat Neary's fault.

It is clear there was huge problems in the Financial Regulator's office but this 'blame game' or point scoring approach is of little use. Also if you actually look at the points the report makes under it's five key headings it is clear that most have them relate to consumer banking and have little to do with the banking crisis we have now.

The consumer banking sides of our main banks are incredibly healthy. There are some issues with the information provided and 'advice' given to consumers but consumer banking did not lead us into this mess - property development and investment banking did that. What we actually need is not a Consultative Consumer Panel Report but a Consultative Investor Panel Report.

In the first six months of 2009 AIB posted an operating profit of €1.7 billion. For the first half of it's financial year BOI recorded an operating profit of €787 million. These figures are huge relative to the value of the banks.

Looking at yesterday's closing share prices we see that AIB has a market capitalisation of about €1 billion and BOI of about €1.2 billion. If you borrowed to buy these banks you would have the loans paid off with less than 12 months operating profit from the banks and would have essentially gotten the companies for free.

Obviously, these banks have huge problems on their balance sheets with huge amounts of their assets (issued loans) worth only a fraction of their book value. The banks' problems are not on the consumer side. They are on the investor/developer side. This nice little video sums it up but note that it is investment loans that are the main problem in our case.


The banking crisis here is different to that in the US which was primarily caused by sub-prime mortgage lending in the consumer sector. The size of this problem has consequences across the financial world. Here it is explained with champagne flutes so loved by our former banking and property development high-flyers.


The report published by the Consultative Consumer Group is useful but some of their shots go 'out-of'bounds'. Consumers are being hurt by the financial and economic situation as today's figure on mortgage arrears reveal. However, we have got to be careful where we are laying the blame, or more accurately, how we are laying the blame.

Currently 'the only show in town' to find our way out of the banking crisis is the National Asset Management Agency (NAMA). The only loans the NAMA will be looking at are investor/developer loans. The €4.8 billion in residential mortgages in arrears of more than three months or the residential mortgages in negative equity will not be part of the NAMA solution.

The investigation that Prof. Patrick Honohan is calling for into the banking sector in Ireland will be paying little attention to consumer banking, if the type of investigation he is looking for is set up. We got snippets of this in Primetime Investigates on RTE last night.

Monday, December 21, 2009

People respond to incentives - the rubbish edition

RTE report on the move today by Dublin City Council to abolish the waiver of domestic waste charges that was in place for low-income households. These households will still be exempt from playing the standing charge, currently €96 per annum, and will get four free lifts per year but will have to pay a charge when they put out their bin for collection after that.

The charge per lift is €6. The average household not on a waiver puts their bin out 16 times a year. A household that puts their bin out 60% of the time (16 times a year) will incur a charge of €6 x 12 = €72. Why did the Council seek to have this change introduced? City Manager John Tierney provides the answer.
Mr Tierney added that the waiver scheme had not been an incentive to minimise output as those on waivers had been putting out almost double the amount of refuse as other households.
Those that did not have to pay a charge per bin lift put their bin out for 100% of collections (26 times a year). Those that have to a pay a charge per use put their bin out for 60% of collections (16 times a year). More here.

People even respond to rubbish incentives.

Research Report Card

Forfas have recently released a study on the output of Irish researchers called "Research strengths in Ireland: A bibliometric study of the public research base" and can be read here. The press release for the report paints a positive picture.

A comprehensive study of publicly-funded research performance has shown that Ireland has improved in terms of the volume and impact of its research. Ireland ranks 8th on the impact of research publications within a group of 20 comparator countries.

The study was conducted on behalf of Forfás and the Higher Education Authority (HEA) by Evidence Ltd., part of the Thomson Reuters Group. It shows that Ireland is punching above its weight in terms of the impact of its research.

The report goes through output and impact factors in a number of key research areas at both a national and institutional level. Here, we will consider the output and impact of business research in Ireland.

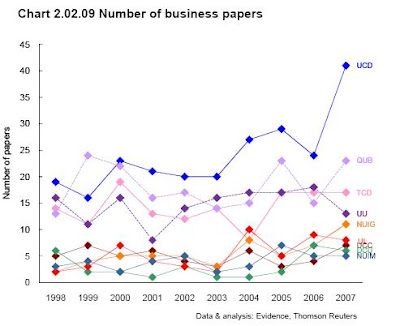
The performance of Ireland in business research is pushed upwards by a jump in 2007 to 123 papers that was well above the 71 paper average of the previous five years. It is not certain that this higher level will be maintained. Even with this increase Ireland still ranks only 17th of the 20th countries included.

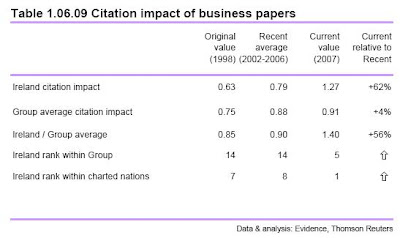
Output may be low but the citation impact (measured as citations per paper) seems stronger

Ireland’s ranking within the comparator group has moved up to 5th, but this position reflects other poor performances relative to world average by a number of comparator nations rather than any great strength in Irish research.

Looking at the total number of research papers by institution across all areas.

The three biggest Irish institutions, UCD, TCD and UCC show strong growth in research output over the ten year period. This growth however has not been replicated in the business area in UCC.

[Note: The section of the report that looked at 20 "project" research areas provided research output data for an area called "economics and business". As with the statistics above the section of the report that looks at institutional performance reports statistics for "business". Economics does not seem to form part of the institutional comparisons. The total number of papers in "economics and business" from 2002-2007 was 568 or an average of 95. There were 344 papers included in "business" from 2003-2007 for an average of 69 a year. It is not clear why a "project" research area is larger than a "main" research area or whether Economics forms part of the "business" main research area.]

UCC is the only institution in Ireland that has seen a drop in the output of business papers. For the five year period 2003-2007, UCC's output of business reserach was just 16% of that of UCD. UCC produced an average of 4.6 business research papers per year. For the entire sample UCC produced 5375 papers with only 250 or 4.6% of these in the business area.

UCC is in a group with NUIM, DCU and UL producing about 5 business research papers per year. NUIG, TCD and, in particular, UCD all having higher business research outputs. The report notes that "Business output volume is still very low, with most institutions producing barely a handful of papers per year. TCD is not increasing its output, so the growth at UCD marks it out as the centre for business research rather than just a leader in a more general growth pattern."

The citation impact of UCC business research is extremely low and is by far the worst of the institutions included. The report again emphasises the performance of UCD noting that "UCD is the only institution with significant volume and growth and its impact is now rising above world average. It is notable that TCD has slipped downwards over several years."

UCC is nowhere.

Friday, December 18, 2009

They think it's all over....it is not

The CSO have released the National Accounts for the third quarter of 2009. The figures reveal that seasonally adjusted GDP rose by 0.3% in the quarter and that technically Ireland is now out of recession.

The first issue to note is that these are provisional estimates. When the GDP figure for Q2 was first released in September the published change was zero. The revised figures indicate that GDP in the second quarter GDP fell by 0.6%. The Q3 figure from yesterday may also be revised downwards. Here is a graph of the quarterly GDP figures for the last five years.


Undoubtedly the recession is "bottoming out" but it is still too early to call it over and we still may have a bit of falling to go. Why? All the elements that make up the GDP figure are declining. All that has changed is the relative pace of these declines that gives the anomaly of a GDP increase.

GDP in make up of private consumption expenditure, firm investment expenditure, government expenditure and the balance of exports and imports. We have

GDP = C + I + G + (X - M)

The following table has the quarterly growth rates for the components of GDP for the past four quarters (table taken from here).


All of the components of GDP are falling and all of these declines have accelerated since the second quarter. The reason GDP has risen on aggregate is because this change has been much greater in Imports than in the other sectors. Imports entail sending money abroad to buy goods from abroad and does not add to economic activity or income here. The Irish economy did not grow in the last quarter, we simply sent less of our money abroad to buy foreign goods. In fact the aggregate of C + I + G (if Ireland was a "closed economy) declined by 2.6% quarter on quarter.

Looking at the GDP figures by sector we do not see much upswing. Click to enlarge.


A minor increase in Transportable Goods Industries and Utilities aside, the trend in most sectors is still downward. There were quarterly decreases in Agriculture, Construction, Transport and Communications, Public Administration and Other Services.

Of course, if you want a measure of national income in Ireland GDP is not appropriate. GNP which takes account of net factor income from abroad is a far better measure. How did that do in the last quarter? Down 1.4% and is now down in eight of the last ten quarters including the last six in a row.

Wednesday, December 16, 2009

Home and Away

The CSO has just released the 2009 Q3 results from the Quarterly National Household Survey (QNHS). This is one of the most important sources of information produced by the CSO and contains much interesting information.

One thing we can learn from the QNHS is the estimated number of foreign nationals (or in the unfortunate vernacular non-nationals) in the labour force. The following graph tracks the number of foreign nationals that are employed and unemployed for six years from the third quarter of 2004. Click graphs to enlarge.


The number of non-Irish nationals in the labour force rose by about 125% from 160k to 365k between 2004 and the end of 2007. Since then the number has fallen back to 317k and continues to trend downward. The numbers unemployed remained below 30k until the middle of 2008 but there are now an estimated 55k non-Irish nationals unemployed.

This 25k increase in unemployment contrasts to the reduction in employment among non-nationals of about 80k from its peak. Approximately two-thirds of non-nationals who have lost their job have left the country. This means that the deterioration of labour market conditions in Ireland is actually worse than that indicated by the unemployment data.

The trend of non-nationals as a proportion of the labour force follows a similar pattern to totals.


At the peak over 16% or one out of every six workers in the Irish Labour Force was a non-Irish national. This is now down to one in seven and the current downward trend will bring it back towards the one in 12 seen at the start of the series in 2004.

If we look at the origin of these workers we see a clear pattern emerging. The number of workers from the UK and EU15 countries in Ireland has been fairly constant over the past six years. There has been some increase in non-EU workers coming to Ireland but the most substantial increase has been in workers from the "EU Accession States" in Eastern Europe.


There has been an average of about 55k workers from the UK and 33k workers from the rest of the EU in Ireland over the past few years. These numbers have been relatively stable. The main increase has been among EU15-EU27 countries. At its peak there was in increase of over 400% in the numbers of workers from these countries with an increase from 35k to 180k. The downward trend over the last two years has seen this drop back to 152k. The increase and drop in workers from non-EU countries is, as would be expected, not as pronounced and there was actually an increase in the last quarter.

If we move from labour force totals to unemployment rates we see that unemployment among non-Irish nationals has been consistently higher than the unemployment rate among Irish nationals.


For most of the graph this difference hovered between 1.5 and 2.5 percentage points but there is now a 5.3 percentage point difference in the unemployment rates between the two groups. Looking at the unemployment rates by origin of work we see


The lowest unemployment rate is among workers from the EU15 at only 7.8%. Unemployment among workers from the EU Accession States is highest with 19.5% of workers from these countries now unemployed.

Reinventing the market for GPs

In his excellent 2002 book, Reinventing The Bazaar, the late John McMillan described how the workable platform for markets has five elements:
  1. Information flows smoothly
  2. Property rights are protected
  3. People can be trusted to live up to their promises
  4. Side effects on third parties are curtailed and
  5. And competition is fostered.

McMillan describes how these platforms aid the effective operation of markets. He also outlined situations in which suitable government intervention can help if the effectiveness of one or more of these platforms are absent. The market for health needs intervention on many many grounds but too often the cure is worse than the disease.

Three of the key pieces of information consumers need to help them are availability, price and quality. There are a huge number of examples of producers trying to conceal this information for their betterment.

The GP market in Ireland is one that has been traditionally characterised by a lack of information. This strategy is part of the practice and ethical guide that the Irish Medical Council issues to GPs. The 2004 edition of the guide required that new GPs could only use newspaper announcements (not advertisements) when opening a practice. All other forms of advertising was prohibited. All internet material must be "non-promotional" and the most suitable place to display prices was inside the practice. Price or product advertising was not allowed. (See sections 6 and  7, pages 20 and 21.)

According to The Competition Authority the effect of these restriction has been to
  • Create barriers which unnecessarily inhibited GPs becoming established.
  • Favour established GPs.
  • Reduce the incentives for innovation on the part of GPs
  • Discouraged price competition in the case of private patients.
  • Make it difficult for consumers to obtain information on the availability of medical services in their area.
If we just consider the effect of the ban on price advertising. A lack of price information means that the consumer must incur search costs to determine the information. It can be shown that in the presence of search costs the equilibrium price in an otherwise competitive market will be the monopoly price. This is the basis of the tourist trap model.

It is in GPs' interests to keep price information from consumers as it increases their profits. It may have been working as this graph from the report by The Competition Authority indicates. Click to enlarge.


Following the concerns raised by The Competition Authority the 2009 edition of the Medical Council guife for GPs removes the formal ban on price advertising and no longer states that prices can only be displayed in the practice (see Section 5.4 page 49).

Along with the recently introduced 50c prescription charge, this attempt to get information flowing more smoothly in the GP market sees increased attempts by government to harness market forces in the market for health rather than suppress them. This is smart.

Tuesday, December 15, 2009

How the tax system works - the Irish edition

Here is a revision of this little parable using the most recently available Irish data (2006).

Suppose that every day, ten men go out for beer and the bill for all ten comes to €100. If they paid their bill the way we pay our taxes, it would go something like this:

The first five men (the poorest) would pay nothing. Nada
The sixth would pay €1.
The seventh would pay €3.
The eighth would pay €9.
The ninth would pay €21.
The tenth man (the richest) would pay €66.

So, that's what they decided to do.

The ten men drank in the bar every day and seemed quite happy with the arrangement, until one day, the owner threw them a curve. "Since you are all such good customers," he said, "I'm going to reduce the cost of your daily beer by €20." Drinks for the ten now cost just €80 total.

The group still wanted to pay their bill the way we pay our taxes so the first five men were unaffected. They would still drink for free. But what about the other five men - the paying customers? How could they divide the €20 windfall so that everyone would get his fair share? They realised that €20 divided by five is €4. But if they subtracted that from everybody's share, then the sixth and seventh man would each end up being paid to drink his beer. So, the bar owner suggested that it would be fair to reduce each man's bill by roughly the same amount, and he proceeded to work out the amounts each should pay.

And so:

The sixth man, like the first five, now paid nothing (a 100% saving).
The seventh now paid €2 instead of €3 (a 33%saving).
The eighth now pay €6 instead of €9 (a 33%saving).
The ninth now paid €16 instead of €21 (a 23% saving).
The tenth now paid €56 instead of €66 (a 15% saving).

Each of the five was better off than before. And the first five continued to drink for free. But once outside the bar, the men began to compare their savings.

"I only got a euro out of the €20," declared the seventh man. He pointed to the tenth man, "but he got €10!"

"Yeah, that's right," exclaimed the sixth man. "I only saved a euro, too. It's unfair that he got ten times more than I!"

"That's true!!" shouted the eighth man. "Why should he get €10 back when I got only three? The wealthy get all the breaks!"

"Wait a minute," yelled the first five men in unison. "We didn't get anything at all. The system exploits the poor!"

The nine men surrounded the tenth and beat him up.
The next night the tenth man didn't show up for drinks, so the nine sat down and had beers without him. But when it came time to pay the bill, they discovered something important. They didn't have enough money between all of them for even half of the bill!

And that, boys and girls, journalists and college professors, is how our tax system works. The people who pay the highest taxes get the most benefit from a tax reduction. Tax them too much, attack them for being wealthy, and they just may not show up anymore. In fact, they might start drinking overseas where the atmosphere is somewhat friendlier.

Fergus and Fintan

The opinion pages of today's Irish Times and Irish Examiner have two similarly themed pieces on how last week's budget shows that the government is engaged in a "war on the poor".

In his Irish Times piece Fintan O'Toole writes:
...the Economic and Social Research Institute produced stark new figures on tax relief for private pensions. It showed that €8 out of every €10 goes to the top 20 per cent of earners. It also showed that giving this relief at the standard rate of tax (which is to say, making it available on an equal basis to all taxpayers) would raise revenue of €1 billion a year – significantly more than the savings made by cutting social welfare payments. More than four-fifths of this money would have come from the richest 20 per cent.
In the Irish Examiner Fergus Finlay concludes:
This is the first time ever that a country has decided that the poor must pay our debts. In all the years of the Celtic Tiger, the gap between rich and poor in Ireland never narrowed. That’s because when the going was good, all the tax breaks were given to people who had plenty. Dozens of tax breaks, year after year. But now we’re in deep trouble and our best response, uniquely in the world, is to target people who have nothing. Being Irish will never feel the same again.
Both writers are displaying an alarming ignorance of how the Irish tax system, or any tax system, actually works. The Revenue Commissioners Statistical Reports provide income distribution and tax burden data for the Irish workforce. The most recent report is for 2008 and the income distribution data for the year 2006 are available here. Ronan Lyons uses the data on page 6 to produce this graph. Click to enlarge.

The horizontal axis gives incomes in €000s and the vertical axis gives the average tax rate. The tax rate does not go above 10% until income gets to about €40,000. What we also need to consider is how many people are in each income category.

Of the 2.25 million cases the Revenue have, nearly 72% have a gross income of less than €40,000. These 72% of earners received 40% of the total income reported. They paid only 12% of the total income tax collected and had an average tax rate of 5.1%.

The 40% of cases who earned less than €20,000 paid 0.62% of the total income tax collected and had an average tax rate of 0.84%. The average amount of income tax paid by the cases in this bracket was €82.60 - for the year!

Yes Fergus and Fintan you are right - the poor do not get tax breaks. But in your rush to produce some good copy you ignore the fact that we do much,much more for them. Whatever money they earn we let them keep. All of it!

The poor do not get income tax breaks in this country because the poor do not pay income tax. You cannot get a tax break if you don't pay tax in the first place.

Fintan and Fergus have noble and valid aspirations, and are right to promote the needs of the poor. It's a pity that their arguments are so flimsy.

For a primer they can read the parable of how the tax system works.

Tax something and you get less of it

The only certain things in life may be death and taxes. In Economics we are certain that people respond to incentives, just not always in ways predicted. This gives rise to The Theory of Unintended Consequences. It's just a theory but the evidence to support it is manifold. [Aside: A super little example can be seen in this report on attempts to preserve fish stocks in the Pacific.]

Anyway back to the taxes. Last week the Chancellor of the Exchequer in the UK, Alastair Darling, announced a super-tax on bankers' bonuses of 50% on all bonus payments above £25,000. This tax was targeted at those who had allegedly caused the finanical crisis and to offset the "bailouts" given to the financial sector.

In this instance a quick look at the incentives should clearly lead to the unintended consequence of this action. Rather than pay the tax, financial firms and their employees will just leave. It seems this may already be happening. Sky News' Business Report Mark Kleinman reports:
I have learned that Tullett Prebon, one of the largest independent financial trading firms in London, is offering its employees the chance to relocate to its offices in Switzerland, Bahrain and Singapore as a result of the uncertainty caused by last week's Pre-Budget Report (PBR).

Whether they will actually move is debateable. And also, it is actually too late for Tullett Prebon's employees to avoid the once-off super tax for this year, as the BBC report. However in an email to staff last week, the Chief Executive of Tullett Prebon (a company which received no "bailout" money), Terry Smith said:

"It is not clear how if at all the Chancellor's announcement yesterday will affect us, but his proposals regarding the way that bonuses are to be treated this financial year, coupled with the explicit refusal to guarantee that similar "one off" taxes will not be imposed next year and in subsequent years, has caused a number of you to once again raise the matter of relocation out of the United Kingdom."

The uncertainty alone may cause some employees to move to Tullet Prebon's offices in Switzerland, Bahrain or Singapore.

Alastair, my darling, surely you know that a bit of something is better than a lot of nothing.

Monday, December 14, 2009

Getting smarter?

In last week's Budget Brian Linehan formally introduced the 50c per medical prescription for medical card holders that had been flagged over the previous few weeks. It seems we are taking at least one leaf out of the Singapore book. Well a bit of a leaf anyway. Singapore combines government subsidies with patient co-payment for virtually all medical care.

When a consumer is insulated from cost they have no incentive to weigh up the costs and benefits of a decision. Once the costs are zero any benefit (or even a perceived possible) benefit will encourage over-utilisation. This is what has happened when medical prescriptions have been free with people collecting the prescription even if they didn't actually need it. In a letter to The Irish Independent one person wrote.
As a public health nurse visiting homes on a daily basis, it is astonishing to note the vast amounts of excess and unnecessary medication which accumulates in people's homes.
There is also other anecdotal evidence of the families of recently deceased relatives returning thousands of euro worth of prescribed medicine to the HSE that had been collected but never used, simply because there was a prescription for it. As the HSE can not vouch for the medicine it must be destroyed. The above letter continues

Despite the fact that many monthly prescriptions are not used in their entirety, and despite both patient and pharmacist being alerted to this, the system allows the entire monthly prescription to be reissued regardless. There is little or no appreciation or consideration of the cost, particularly as this flawed system is paid for by the taxpayer, who, by the way, is not entitled to free medical care or medications.

Many years go when I lived and worked in the UK, a charge was payable for each prescription. The busy GP might have been quick to issue the prescription but I had a little more time to consider if the purchase was essential enough for me to hand out the charge rather than the easier option of obtaining the item, knowing someone else was paying for it. The 50c per item fee is negligible and will go some way to reducing the vast mount of unnecessary prescribing and waste.

This public health nurse would make a fine economist.

We are finally cottoning on to the idea that anything free will be over-utilised. And that even a small charge can have a big impact. The blight of plastic bags was "cured" when a small charge was introduced that made people consider whether it was actually worth using a plastic bag to home a pint of milk and a packet of biscuits. When A&E visits were free (in money terms) many patients who should have gone to their GP made unnecessary trips to an Accident and Emergency Departments in situations that were neither an accident or an emergency.

Of course, the issue of setting the appropriate charge remains. The plastic bag levy began at 15c in 2002 and is due to be increased to 44c next year. A&E charges currently stand at €100 compared to an average of €60 for a visit to the GP.

Replacement Rates, Unemployment and Poverty Traps

On the 4th of December the Department of Finance published a short report on Replacement Rates and Unemployment. The six-page document can be accessed here.

What are Replacement Rates?
The replacement rate for given income levels measures the proportion of out-of-work benefits received when unemployed against take home pay if in work. While there is no pre-determined level of replacement rate which would influence every individual’s decision to work, clearly the higher the replacement rate, the lower the incentive to work. A replacement rate in excess of 70% is considered to be excessive.
Thus it is a measure of how much of a person's family income would be replaced if they were to lose their job/income and start receiving social welfare. Why they are of concern in Ireland is nice captured in this letter which appeared in The Irish Independent back in April. Andy's friend may be imaginary but the general argument is true.

High replacement rates lead to Unemployment Traps which occur

"when a person’s out-of-work family disposable income compares favourably with his/her in-work family disposable income, thereby resulting in disincentives to work.
A related problem are Poverty Traps which occur
"for those in employment when an increase in an employed person’s gross income results in a reduction in net income, thereby resulting in disincentives to work for higher earnings or work for increased hours. This can arise because of a move into a higher tax bracket or because of withdrawal of social benefits as gross income crosses certain thresholds."

The Department produces replacement rates for three income levels

  1. The national minimum wage (NMW) = €17,542
  2. 67% of the average industrial earnings (AIE) = €22,535
  3. The average industrial earnings (AIE) = €33,634

and they are reproduced in the following table.

Summary:

  • Single people with no children (28% of Live Register cases) face high replacement rates at the national minimum wage, although below 70%. Replacement rates are not an issue for higher earning single people.
  • Couples with no children where both are not working (10% of Live Register) face high replacement rates at each income level up to AIE, though these are under 70% except at NMW.
  • Couples with one or two children where both are not working (5% of Live Register)have higher replacement rates again. These are 70% and above for couples with one or two children who would earn at two thirds AIE (c. €22,500) or less.
  • One-Parent Families (29% of Live Register cases) have low replacement rates except where out-of-work income is supplemented by Community Employment Scheme (CES) earnings.
  • There are significant welfare benefits for couples for one working at NMW or two thirds AIE; as the other spouse can claim entitlement to means tested JA.
  • Rent supplement has the potential to introduce significant disincentives to work and is received by 12% of cases on the Live Register.

For example, of couple claimants in receipt of rent supplement 43% have no children and they could face replacement rates as high as 102% if the maximum rate of rent supplement (based on Dublin rates for a couple with no children) was paid out-of-work and no rent supplement paid while in-work, i.e. they would have a higher family income if they remain out-of-work!

dd

People respond to incentives - the science cheat edition

As we well know all of economics can be summarised by just four words - "people respond to incentives" - the rest is commentary.

Thierry Henry handled the ball because the benefits of cheating were greater than the cost. What incentives can we find that underlie the academic and scientific fraud that has taken place at the Climatic Research Unit in the University of East Anglia for at least ten years?

A quick check of this spreadsheet reveals some of the answers. Click it and see where the money to keep Phil Jones and his buddies happily engaged in fraud in the CRU has come from.

The file reveals details of 53 projects in with Prof Phil Jones is the sole or a joint PI (principlal investigator). The 53 projects see Jones allocated £13.7million pounds at an average of just over £250,000 per approved grant application. That is a lot of money to be playing around with.

Where did this pocket money come from? Prof Jones and his cronies are hugely grateful to the taxpayers of the UK, the US and the EU for funding as they have received grant after grant from the UK Met Office, the US Department of Energy, the EU Commission and several other public bodies.

If somebody has a story they want told and are willing to pay to have that story told it is only human nature that someone will gladly help them out when the right incentives are in place. This is a superb explanation of what happens.
Universities and departments have set policies to attract climate science funding. Climate science centers don’t spontaneously spring into existence – they were created, in increasingly rapid numbers, to partake in the funding bonanza that is AGW. This by itself is not political – currently, universities are scrambling to set up “clean energy” and “sustainable technology” centers. Before it was bio-tech and nanotechnology. But because AGW-funding is politically motivated, departments have adroitly set their research goals to match the political goals of their funding sources. Just look at the mission statements of these climate research institutes – they don’t seek to investigate the scientific validity or soundness of AGW-theory, they assume that it is true, and seek to research the implications or consequences of it.

This filters through every level. Having created such a department, they must fill it with faculty that will carry out their mission statement. The department will hire professors who already believe in AGW and conduct research based on that premise. Those professors will hire students that will conduct their research without much fuss about AGW. And honestly, if you know anything about my generation, we will do or say whatever it is we think we’re supposed to do or say. There is no conspiracy, ust a slightly cozy, unthinking myopia. Don’t rock the boat.

Gender wage discrimination starts early

The BBC report the results of the 2009 Halifax Pocket Money Survey. Halifax have been carrying out the survey since 1987 and have found that over that time pocket money has increased by more than four times the rate of inflation. Halifax are most interested in the savings behaviour shown but there are some other interesting findings.

The UK average pocket money for 2009 is £6.24 a week which is an 11p or 1.8% increase on the 2008 figure but is still substantially below the 2005 high of £8.37 a week. The UK's Office of National Statistics combined the Halifax survey with their own data to create the following graph.


Children with family incomes in the highest income decile received the biggest amount of pocket money. Interestingly, the next highest recipients were children whose family incomes were in the lowest income decile. The data do not allow us to determine if pocket money is a substitute for or additional to other expenditure by parents across the income deciles.

The higher than inflation increases in pocket money have not been evenly distributed with those in the 8-11 age group getting an average of £4.80 a week in 2009 which is some 425% above the 1987 figure of £1.13 reported here. Those in the 12-15 age bracket are getting the higher amount of £7.44 a week but this is "only" some 215% higher than the £3.46 their counterparts from 1987 were receiving. The survey also reports big regional variations across the country but one of the more standout findings is that:

Across the country, boys received an average of £6.88, compared with girls' £5.58.

This difference of £1.30 per week equates to a pocket money differential of about 23%. Gender wage discrimination, it seems, starts early!

Wednesday, December 9, 2009

Ireland may be neutral but her money is not

Bloomberg recently ran a report looking at the returns earned by Irish Life, Ireland's biggest fund manager. The report begins:
Dec. 3 (Bloomberg) -- Irish Life Investment Managers, Ireland’s biggest fund company, is defending its top-ranked returns by investing in makers of military equipment.

Brendan Moran, who oversees 15 billion euros ($22.6 billion) as head of global equities at the Dublin-based company, bought Lockheed Martin Corp. and BAE Systems Plc because he predicts defense budgets will stay high.

“Their share prices haven’t gone up; the earnings haven’t come down,” Moran, 42, said in an interview at Bloomberg’s Dublin bureau. “As a consequence, they are more attractive to us on valuation.”

The U.S. government in October authorized a further $130 billion for military operations in Iraq and Afghanistan, bringing to more $1 trillion the amount spent since the Sept. 11 terrorist attacks. President Barack Obama said Dec. 1 he will send an extra 30,000 troops to Afghanistan next year.

The 12 members of the Standard & Poor’s 500 Aerospace & Defense Index trade at an average ratio of 13 times their earnings compared with an average 22 for companies in the Standard & Poor’s 500 Index.
Public opinion in Ireland is in favour of our neutrality stance. After the first Lisbon Treaty research conducted on behalf of the Department of Foreign Affairs indicated that uncertainty about Irish neutrality was a significant issue in the rejection of the Treaty. The Irish Defence Forces will not be sending any equipment or personnel for military operations in Iraq and Afghanistan. But we will be investing plenty of our money into the effort.

You can listen to a short interview with Brendan Moran here who airs his concerns about the impact changes in global defense budgets may have for his Irish investors. Neutral how are you!

Tuesday, December 8, 2009

Who's smart?

New Geography has just released a survey of the world's smartest cities and lists "the 'smartest' cities not only by looking at infrastructure and livability, but also economic fundamentals". Singapore comes out on top with Amsterdam the only European entry, though the list is a little Americentric with seven cities (four US, one Mexico, one Brazil and one Canada) on the list.
  1. Singapore: The 21st-century successor to 15th-century Venice, this once-impoverished island nation now boasts an income level comparable to the wealthiest Western countries, with a per-capita GDP ahead of most of Europe and Latin America. Singapore Airport is Asia's fifth-largest, and the city's port ranks as the largest container entrepot in the world. Over 6,000 multinational corporations, including 3,600 regional headquarters, are located there, and it was recently ranked No. 1 for ease of doing business.

This country has an aspirational plan based around Building Ireland's Smart Economy. Maybe Ireland (population 4.45 million) should be having a look at what Singapore (population 4.75 million) is doing to smarten up. Reading Singapore's Success: Engineering Economic Growth would be a good start. This reveals that Singapore implements many economically efficient (though politically unpopular) policies so that Singapore:

  • has unilateral free trade
  • admits unusually large numbers of immigrants
  • supplies most medical care on a fee-for-service basis
  • means-tests most government assistance
  • imposes peak load pricing on roads, and
  • fights recessions by cutting employers' taxes

Brian Caplan offers three possible explanations of the paradoxes of Singaporean political economy.

Thursday, December 3, 2009

Serious floods lead to broken windows

In an article in yesterday's Irish Times, the ESRI's Prof Richard Tol suggests that the clean-up operation may boost the economy. A short extract gives the main details.
Prof Richard Tol of the Economic and Social Research Institute (ESRI) has said that while the flooding has caused widespread damage, there may be an unexpected fillip to the economy once the clean-up operation begins. “Floods are bad but flood restoration can actually provide a stimulus to the economy,” said Dr Tol.

Dr Tol pointed out that he was not downplaying the impact the floods had on people who lost their homes and businesses, some of whom were not insured. However, he said that one of the unusual consequences of the restoration work, once it begins, is that it will provide an economic stimulus, generating local work and business in construction, engineering and in retail sales.

“What the water has done is it has destroyed many things. But once insurance is paid, there will be a lot of money coming into the country. Most of the funds will come not from Irish insurance companies but will be called in from international reinsurers. So it will be mostly coming from abroad, which is a stimulus.”

He said that consumption would increase in affected areas as restoration work began, providing a measurable boost. “As such there is a silver lining to the flood,” he added.

A silver lining! An estimated €250 million euro worth of property has been destroyed and Tol finds a "silver lining". Quick, get the ESB to open up more dams! The path out of the recession has been found. Surely they'd be able to cause at least double the damage again in no time at all and we'd have twice as much of this "silver lining". And don't send the army in to help people. Have them get out the heavy artillery (they do have guns, don't they?) and blow up buildings and stuff on high grounds that escape the floods. Pretty soon we'll have enough "silver lining" for everybody.

Richard Tol, what are you at? Yes the floods will lead to expenditure on repairs but that money will come from reduced expenditure elsewhere. Open your other eye! Have you every heard of The Lesson which Hazlitt brought to us from the work of Federic Bastiat. You must have!

Here is Hazlitt's piece on the simplest application of The Lesson as proposed by Bastiat. The Broken Window is short enough to reproduce here in it's entireity. Read it. Think of the €250 million that will be spent on flood repairs. Read it again.
Let us begin with the simplest illustration possible: let us, emulating Bastiat, choose a broken pane of glass.

A young hoodlum, say, heaves a brick through the window of a baker’s shop. The shopkeeper runs out furious, but the boy is gone. A crowd gathers, and begins to stare with quiet satisfaction at the gaping hole in the window and the shattered glass over the bread and pies. After a while the crowd feels the need for philosophic reflection. And several of its members are almost certain to remind each other or the baker that, after all, the misfortune has its bright side. It will make business for some glazier. As they begin to think of this they elaborate upon it. How much does a new plate glass window cost? Two hundred and fifty dollars? That will be quite a sum. After all, if windows were never broken, what would happen to the glass business? Then, of course, the thing is endless. The glazier will have $250 more to spend with other merchants, and these in turn will have $250 more to spend with still other merchants, and so ad infinitum. The smashed window will go on providing money and employment in ever-widening circles. The logical conclusion from all this would be, if the crowd drew it, that the little hoodlum who threw the brick, far from being a public menace, was a public benefactor.

Now let us take another look. The crowd is at least right in its first conclusion. This little act of vandalism will in the first instance mean more business for some glazier. The glazier will be no more unhappy to learn of the incident than an undertaker to learn of a death. But the shopkeeper will be out $250 that he was planning to spend for a new suit. Because he has had to replace a window, he will have to go without the suit (or some equivalent need or luxury). Instead of having a window and $250 he now has merely a window. Or, as he was planning to buy the suit that very afternoon, instead of having both a window and a suit he must be content with the window and no suit. If we think of him as a part of the community, the community has lost a new suit that might otherwise have come into being, and is just that much poorer.

The glazier’s gain of business, in short, is merely the tailor’s loss of business. No new “employment” has been added. The people in the crowd were thinking only of two parties to the transaction, the baker and the glazier. They had forgotten the potential third party involved, the tailor. They forgot him precisely because he will not now enter the scene. They will see the new window in the next day or two. They will never see the extra suit, precisely because it will never be made. They see only what is immediately visible to the eye.

Aren't all these international insurance companies nice to be giving us this "stimulus" money to pay for the flood repairs and they'd never want it back. Would they?

UPDATE: Prof. Tol took his ideas from the paper of record and put them over the airwaves with George Hook on Newstalk's The Last Word. You can listen to the short interview by going here.

Tuesday, December 1, 2009

I hope they don't teach what they preach!

Today has seen Finbar Geaney of the Dublin City post primary branch of the TUI make a number of media appearances. He started the day on RTE's Morning Ireland, later on he spoke on Lunchtime with Eamon Keane on Newstalk and finished the with an segment on Today FM's The Last Word with Matt Cooper. His RTE interview is available here.

What did he say? Here is an extract from a press release issued by the TUI Dublin Branch.

Speaking at press conference in Dublin today Finbar Geaney of the Dublin City Branch of the Teachers Union of Ireland said that we are witnessing the greatest betrayal in the history of the Irish trade union movement. The ICTU officials have bought the entire government agenda and are behaving now as government agents within the trade unions. However this pay cut will be resisted and the union leaders who are attempting to foist in on their members will be replaced through the action of ordinary members.

Ireland is a rich country and it is time to make the multimillionaires and billionaires pay for the crisis which is their creation.

Geaney claimed that people were gambling "hundreds on billions" on the stockmarket and that had Sean Quinn being taxed for one billion he would not have been able to lose in trades involving shares in Anglo Irish Bank. He also claimed that a broad increase in taxes on Denis O'Brien, Bernard McNamara and other high net worth individuals is the optimum route out of the crisis in the public finances.

Another group give a similar set ideas here (This group is related to Finbar Geaney though he named in an article in the pamphlet. Though he may not be entirely unrelated if he is the same Finbar Geaney who wrote this 1972 piece). Anyway the set of proposals that include:

  • Overhaul the tax system to create an equitable system. Make the rich pay more tax.
  • Emergency legislation to close the tax exile rule which allows the wealthy to abscond without paying taxes.
  • Remove all property-based tax incentives.
  • Tax all income over €100,000 at a surcharge rate of 70 percent.
  • Introduce a special 3% wealth levy on all income producing assets and houses, except the family home, for those earning more than twice the average industrial wage.
  • Cut VAT rates and increase capital gains and corporation tax.
  • Introduce a 35-hour week, while preserving existing pay rates in order to create extra jobs.

The general view here is a case of taking from one group simply because they have more. Is this what they also say in the classroom? I hope not! Don Boudreaux has an excellent piece in The Pittsburg Herald Tribune from 2005 contrasting our attitudes to property in how we deal with children and how we deal with each other. The piece is Simple rules for a complex world.

Take, for example, the rules to avoid envy and not take other people's stuff. In political discourse envy is stoked to encourage the taking of other people's stuff. Politicians proudly exhort audiences to covet wealth possessed by others. In stentorian tones they promise to take from the never-precisely-identified "rich" and give to the rest of us. We're told that we deserve this wealth simply because others have more of it than we do.

Would you ever tell your child, "Junior, if any of your classmates have nicer toys or more candy money than you have, you should envy those classmates. Stew in anger and resentment that some children have more material things than you have!"

Of course, no parent would even think of feeding his child such dysfunctional advice. So why do so many adults tolerate -- and even applaud -- identical sentiments when expressed by politicians? When candidates stump for income "redistribution" on the grounds that some people have more money than other people, they're playing upon and fueling envy -- an especially ugly and anti-social sentiment.

Speaking of thievery, what parent wouldn't severely punish a child who actually took a classmate's money or toys? What parent would excuse this offense if the child says, "I took it because my classmate is richer than me"? Or if the child says, "I took it because I can use those things better than my classmate can"? I've yet to meet the parent who would tolerate such behavior or such self-serving excuse-making in his children.

Yes, yes, I know that ours is a republic in which we allegedly consent to taxation through the political process, by majority rule. But I remain uneasy. If Thomas informs me that he and several of his friends took another playmate's money after voting to do so, I'll be furious with him. And my fury will only grow if he tries to excuse his gangster thievery by telling me that the election was a fair one in which even the victim cast a ballot.

Our world indeed is complex. But because the rules we teach our children unambiguously promote their well-being and the well-being of our society, we should apply these rules with much greater consistency and not excuse voters and officeholders from these rules just because they're acting politically.
If it's good enough for our kids it should be good enough for the rest of us.
 
Unsecured Loans Proudly Powered by Blogger