Wednesday, August 31, 2011

Recapitalising the banks

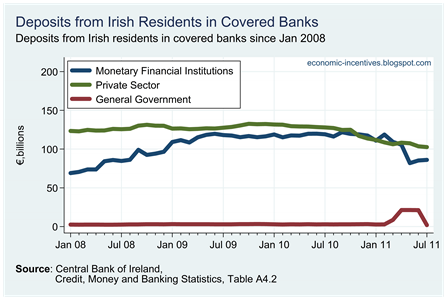
We can see the effect of the recent State recapitalisation of the covered banks in the Money, Credit and Banking Statistics.  Here are Irish resident deposits in the covered banks.  Our focus here is on government deposits.

Irish Resident Deposits in Covered Banks

After being below €3 billion for several years, government deposits in the covered banks jumped to €21 billion in April.  This was the money liquidated from the NPRF and borrowed from the EU/IMF that would be used to recapitalise the banks.  This was to be done in March but was delayed until after the general election.

Government deposits stayed above €21 billion until June and in July dropped to €2 billion.  Where did the money go?  The capital and reserves part of the balance sheet shows us.

Capital and Reserves

The fall in deposits from government is offset by the rise in capital in the bank. Our capital.  The covered banks have more capital in them that at any time since 2003.  By any measure the covered banks have “lots” of capital.  Loss losses and write-downs will consume some of this.  How much is the subject of much debate.

There has been some suggestions that the banks have been using this money to buy Irish government bonds.  Here is an extract from this article in the Sunday Business Post discusses the recent falls in Irish government bond yields.

Some caution is required, for a few reasons. It appears that among the buyers of Irish bonds in recent weeks have been the Irish banks themselves.

Following state cash injections under the recapitalisation programme agreed with the EU and the IMF, Irish government bonds have been seen as an attractive place to put some cash, while also supporting the ‘‘home team’’.

It is impossible to say how significant this has been - a number of market sources say it has contributed, but that the international re-rating of Ireland has been more important.

The data do not really support this thesis (yet).

Irish Securities held by Covered Banks

Holding of bonds issued by the government increased from €9.4 billion to €9.6 billion in July.  The covered banks hold about 10% of Irish government debt. 

With volumes low, €200 million may have been enough to have some impact on bond yields.  It is also possible that more significant purchases may have taken place towards the end of July and after the reporting date for the above data.  It will be interesting to watch this number in the August release.

Central Bank Funding stays at €125 billion

Today’s release of the Money, Credit and Banking Statistics by the Central Bank gives us a glimpse into the performance of the banking sector.  One key measure is the reliance of the covered banks (BOI, AIB (+EBS), PTSB and IBRC (Anglo + INSB)) on central bank funding.  This peaked at around €155 billion in February but fell to below €130 billion two months later and has been steady since then.

Central Bank Funding

The mix has been changing slightly.  Since April funding from the European Central Bank’s Main Refinancing Facility has fallen from €74 billion to €68 billion. At the same time funding sourced through the Central Bank of Ireland’s Emergency Liquidity Assistance has risen from €54 billion to €57 billion.

As the collateral requirements for the ECB are higher this suggests that the quality of the collateral offered by the banks has been falling.  The interest rate on the ECB funding is 1.5% while the money received through the ELA is thought to carry an interest rate of around 3.0%.

Tuesday, August 30, 2011

Evening Echo Article 29/08/11

I wrote an article last week that was carried by Monday’s Evening Echo.  The goal was to highlight some positive elements of the current economic situation.  I must have been in a very good mood as I took this ball and ran with it.  Some revised numbers have been released since this was written but, in the main, it holds up.

Reasons to be cheerful parts one, two and three

The Irish economy has taken a battering over the past four years.  The unemployment rate has risen to 14%, the banking system collapsed with the crash in the property market and a €20 billion hole opened in the public finances. 

These are all problems that will not be resolved easily.  However after four years where the news was unrelentingly negative, we have had occasion recently where some positive economic developments leaked into news cycle.  Here are nine that are worth recounting.

First, there were the preliminary results from Census 2011.  In the run up to the census it was believed that the population was just under 4.5 million.  The census revealed that the population was actually 4,581,269.  There are nearly 100,000 more people living in Ireland than was previously thought. 

There are reasons to believe that the return to emigration, particularly among Irish nationals, is not as large as anecdotal evidence and media reports have been suggesting.

The full impact of these extra 100,000 people will be seen when the CSO revise their population statistics over the next few months.  Although it is possible that some of these extra people could be in the under-16 or over-65 dependency groups, most of them will be in the 16 to 65 age bracket so it is likely there are more people working than was previously estimated by surveys.

Second, the census also confirmed the positive age demographics of the Irish population.  With many developed countries set to face an increased burden due to an aging population, Ireland, in contrast, is experiencing a baby boom.  The natural increase in the population (the difference between births and deaths) was a record 45,000 per annum. 

As recent as 1996, the natural increase was recorded as 18,000 per annum.  Ireland is set to have a young and productive population in the coming years.

Third, the number of people visiting Ireland is increasing.  In the first six months of 2011 three million visitors came to Ireland from abroad.  During the same time in 2010 there were 2.6 million visitors.  This 13% increase in visitors was spread across our main tourist markets; the UK, the US and Europe.  More people visiting the country means more money coming into the country.

Fourth, there is also more money coming into the country as a result of our booming export sector.  Last year there were €44 billion of goods exports from Ireland to the end of June.  This year has already seen €47 billion paid from abroad for goods manufactured in Ireland.

Cork has a vital role to play in Ireland’s exports.  More than 60% of Irish goods exports are in the chemical and pharmaceuticals sector and this industry is heavily concentrated around Cork.  Even in the midst of the global downturn pharmaceutical exports from Ireland increased by 60%.

The pharmaceutical sector is very capital intensive and does not generate the number of jobs that would reflect an industry that dominates our exports.  However, it does provide employment at wages higher than most other sectors. This will be further boosted by the announcement that Sangart are going to create 250 jobs in Carrigtwohill, up from 120 when the project was initially announced just a month ago.

Fifth, the agri-food sector is also on the up.  This sector makes up one-twelfth of our overall exports and is much more labour-intensive than the chemicals sector.  Exports of food and live animals are up 20% on 2010. 

The best performance has been in the dairy sector where exports are up nearly 50% on last year.  Our temperate climate and quality of grazing land means to potential to expand is virtually unlimited as there is huge demand for Irish milk in the powdered milk and baby formula markets.

Sixth, domestic consumption is beginning to stabilise.  The retail sales index is showing a small increase on last year.  This may only be 0.2% but it does indicate that the drops of recent years have ceased.

Sales of new cars have been strong component of retail sales in 2011with 81,175 new passenger cars sold up to the end of July.  By the same time last year 73,846 cars had been sold.  There are many households in serious difficulty but sales of ‘big ticket’ items such as cars are slowly recovering. 

Seventh, figures from the Central Bank show that the balance sheet of the household sector is slowly improving.  At the end of 2008, the household sector has loan liabilities totalling €203 billion.  The most recent figures show that this has fallen to €185 billion.  There has been an €18 billion fall in household debt in just three years.  Most of this is because of repayments.

There have been calls recently for blanket debt forgiveness of mortgages.  It is important to note only 3% of Irish households are in mortgage arrears.  Around half of Irish households do not even have a mortgage.  Data from the Financial Regulator highlights that 90% of mortgages are being repaid according to the terms of the original contract. 

Eighth, the Irish government is benefitting from reduced interest rates.  At the most recent EU summit the interest rate on the money we are borrowing from the EU as part of the EU/IMF programme was reduced from 6% to 4%.  This has the potential to generate savings of close to €1 billion per annum on interest costs.

Ninth, the yields investors require when purchasing Irish government bonds have been falling.  In the run-up to the summit, the two-year bond yield was 23%.  Such a return is indicative that these bonds were considered very risky.

There is €12 billion of Irish government bonds due to mature on the 15th January 2014.  Each holder of that bond will get €100 on that date and €4 per year in interest for holding the bond.  Buying that bond would return around €110 for the investor if it was repaid in full.

On the 18th of July this bond could be bought for just €68.  There were huge doubts Ireland would be able to repay these bonds after the expiry of the EU/IMF program in 2013.  This bond is now trading at €90 which is a huge rise in just a few weeks.

In the context of our overall problems these positive developments are small.  They are not going to provide jobs for the 350,000 unemployed or fix the banks or close the remaining €15 billion budget deficit.

When taken collectively though they do show that the Irish economy is not flat-lining.  The willingness of Wilbur Ross and a group of investors to pump more than €1 billion into Bank of Ireland shows that there are others who have confidence in the Irish economy to recover. 

This recovery will be difficult and there is a lot to be done to get the public finances under control. There will be a huge burden placed on society in trying to achieve this, but it is better to be doing this with a growing population, positive demographics, increasing exports, rising tourism, booming agriculture, stable consumption, reduced household debt, lower interest rates and falling bond yields than without these positive developments.

Monday, August 29, 2011

Retail Sales; Tourist Numbers

The release of the July Retail Sales Index shows a slight rise in retail sales.  Core retail sales (excluding motor trades which make up 21.6% of the July index) rose by by both value and volume when compared to June.

Ex Motor Trades Index to July

The monthly rise is not suggesting that the decline in retail sales is over and the annual changes for both the value and volume series remained negative as has been the case for over a year now.

Annual Change Ex Motor Trade Index to July

The monthly changes show the volatility that highlight that a monthly swing is not to be considered a change in the long run momentum of the series.

Monthly Change Ex Motor Trade Index to July

One factor related to sales in Ireland (and not confined to retail sales) is the number of visitors from abroad.  An increase in visitors should lead to an increase in consumption. 

The CSO’s Overseas Travel release shows that in the first six months of 2011 there were 3.0 million visitors from abroad compared to 2.6 million in 2010 – an increase of 13%.

Separate data in Table 13 from the CSO’s National Income and Expenditure Accounts show that non-residents spent €3.1 billion in the economy in 2010.  If the 13% increase in numbers is maintained for the year and corresponds to a similar increase in expenditure by non-residents then consumption in this category will rise to around €3.5 billion.

Mortgage Arrears Data

The Financial Regulator has just released the June 2011 update of the Mortgage Arrears Statistics.  The headline figures will get plenty of attention.  Here are some related points.

The number of owner-occupied mortgages in Ireland is now 777,321 and the total balance outstanding on them is €115 billion.  This is down from 782,429 mortgages owing €116 billion in the March release. 

Additional data from the Irish Banking Federation show that around €350 million new mortgage lending was provided to first-time buyers and for top-ups in the March to June period.  Lending to mover-purchasers and for remortgages may mean new lending could be even higher.

The €870 million in the outstanding amount and the €350 million in new lending means that around €1.2 billion of capital repayments were made in the quarter.  The data may be about mortgage arrears but it also shows that substantial mortgage repayments are also being made.

The average balance on all mortgages in Ireland is €148,000.  The average balance of mortgages in arrears is €194,000.

The 55,763 mortgages in arrears have €947 million in arrears owing or nearly €17,000 per mortgage.  For the 40,000 mortgages more than 180 days in arrears the average is €21,500 per mortgage.  Twelve months previously there were 24,000 mortgages in this category with average arrears of €19,500.

There were 6,154 households who moved into mortgage arrears in the second quarter. In the same period around 5,500 households became mortgage free.

Sunday, August 28, 2011

Ouch!

Here are two paragraphs extracted from from a New York Times article on possible Republic Presidential nominee Michelle Bachmann.

Bachmann Promises Fast Economic Turnaround With Tax Cuts

Sketching her prescriptions for the economy, Mrs. Bachmann often tells voters that she was one of only a few House Republicans to oppose the debt ceiling agreement this summer. And she draws applause by promising to close the “job-killing” Environmental Protection Agency.

But on Saturday she ventured into less familiar territory, pointing to the example of Ireland: “There are over 600 American companies that have gone to Ireland because of the tax rate,” she said. “Over 100,000 jobs. I want those 100,000 jobs back in the United States.”

HT: Mark Little

Friday, August 26, 2011

Onwards and downwards

As predicted by Cathal in the comments the Irish ten-year bond yield as calculated by Bloomberg has indeed dropped below 9% this week.

Bond Yields 3M to 25-08-11

This has been a remarkable performance.  It would have been reasonable to expect the surge in the yield in the run up to the EU summit to be reversed.  However, a drop from 14% to 11% would have been enough to achieve that.  Instead the yields have continued onward and downward and are now at 8.8%.

Thursday, August 25, 2011

Yields near 9%

Although it is an artificially created measure and the actual values it takes have no psychological meaning the 10-year Irish government yield calculated by Bloomberg is hovering just above 9%.  As I write this it is 9.057%.

Bond Yields 1D 25-08-11

This is still well above the level the would allow new Irish government bonds to be issued to the market.  We have access to EU/IMF funds at around 4.5% so the yield is still twice that.

However, the yield is close to the coupon we are paying on some of our debt.  There is a €9.1 billion tranche of Promissory Notes to Anglo and INBS that has an annual coupon of 8.6% as outlined here.

While the drop in the 10-year yield from over 14% a month ago to 9% now has been quick, the drop in the two-year yield has been almost alarming.

Bond Yields 6M to 25-08-2011

On the 18th July the 2-year yield was over 23%.  This morning it it is 8.7%.  The Irish government bond with a 4.0% coupon that is due to mature on the 14th January 2014 could be bought for around €68 for each €100 unit when the yields reached their peak. 

In just a little over five weeks the price of this bond has risen to near €90.  There probably isn’t too many who were able to buy when the yields spiked towards the end of July, but those that did are sitting on a very tidy profit.

The Irish 2-year yields is 8.7%. What is Greece’s?

Tuesday, August 23, 2011

Half-Year External Trade Data

This morning the CSO released the preliminary external trade data for the first six months of the year.  Final details on merchandise trade for the first five months were also released.  The headline figures are positive with a record seasonally-adjusted trade surplus of €4.1 billion recorded for June.  The €21.9 billion surplus for the first six months of the year is also a new high, ahead of the €21.1 billion recorded for the same period last year.

The trend in imports and exports has been upward for 2011.

Monthly Imports to June 2011

During 2008 and 2009 the trade surplus was growing, but not because of any increase in exports.  The trade surplus was growing because imports were falling.  This trend has now reversed and both imports and exports have been improving in 2011. 

Here is the trade balance.  Although June was a record, it is not that much greater than the level seen for several months for the past year or so.

Trade Surplus to June 2011

Here is the detailed performance up to the end of May of the export categories used by the CSO.  Click to enlarge.

Exports by Category to May 2011

Exports are more than 6% up on 2010, but excluding chemicals and related produces exports are up less than 1% on last year and are still nearly a quarter down on 2007.  Excluding chemicals exports are only €120 million up on 2010. 

Chemicals and related products (including pharmaceuticals) comprised 62% of total merchandise exports for the first five months of the year and clearly dominate Irish merchandise trade.

Exports by Category Proportions

Here are Chemical exports since 2005.

Chemical Exports to May 2011

If we exclude Chemicals and look at the export performance of the remaining categories, the view is not so positive, though the downward momentum of 2008 and 2009 is slowly being reversed.

Exports excluding Chemicals to May 2011

The category that has driven most of this decline is Machinery and Transport Equipment.  This category includes computers and these exports are down substantially over the past few years.

Machinery and Transport Equip Exports to May 2011

On the other exports of Food and Live Animals have been improving in the past 18 months.  These exports only make up one-twelfth of the total but highlight the recent improvement (price increases to the rest of us) in the agri-food sector.

Food and Live Animal Exports to May 2011

Finally, here is a quick glimpse and the increase in imports and in particular the imports by use data provided by the CSO.

Goods Imports by Use

It is the import of production materials that drove the fall in overall imports.  These have begun to recover, albeit slowly.  Imports of consumption goods are also showing a very gradual increase.

Saturday, August 20, 2011

Mortgage Repayments

Irish households are making capital repayments of around €5 billion per annum on their stock of mortgage debt.

The first release of the Financial Regulator’s Residential Mortgage Arrears and Repossession Statistics shows that in September 2009 there was €118.6 billion of outstanding balances on all owner-occupied mortgages in Ireland.  The most recent release gives data for March 2011 and shows that there was €116.0 billion on the outstanding balances. 

Over the 18-month period in question the total balance had decreased by nearly €3 billion.  However, this does not give the full capital reduction on the mortgages that were outstanding in September 2009 as new lending issued since them would be included in the March 2011 figure from the Financial Regulator.

Although not perfect, we can use the Irish Banking Federation’s Mortgage Market Profile data to gauge new lending in the mortgage market.  This data is estimated to represent 95% of the mortgage market and provides details of new lending in five categories

  • First-time buyer
  • Mover-purchaser
  • Residential investment
  • Re-mortgage
  • Top-up

For our purposes here we can ignore residential investment mortgages as the mortgage arrears data only includes owner-occupied mortgages.  There are two categories that are definitely new lending: first-time buyers and mortgage top-ups.

In the 18 months between September 2009 and March 2011, there was €3 billion of mortgages issued to first-time buyers and €0.8 billion of top-ups provided to existing borrowers.  There will have been some capital repayments on this €3.8 billion but for simplicity we will assume it to be small.

The treatment of the lending to the other two categories is less clear-cut.  Re-mortgages are borrowing to repay existing loans (switching product or lender).  We will assume that the €0.7 billion of re-mortgage lending was equal to the value of the existing mortgages.  This would mean that no new lending was issued.

For mover-purchases the outcome is even more uncertain.  The purchaser may or may not have had a mortgage on the original property.  If there was no mortgage then the lending will have been new lending.  If they have an existing mortgage, then the new mortgage may be more or may be less less than the mortgage on the original residence. 

Although there is no indication to believe it is true we will assume that the €2.3 billion issued to mover purchasers matches the loans they had on their existing property.  Again this would mean that no new lending was issued.

It is probable that both of these assumptions are conservative.

Once we account for the €2.8 billion reduction in the overall outstanding amount and the €3.8 billion of new lending for first-time buyers and top-ups then the €118.6 billion owed in September 2009 was actually reduced by around €6.5 billion over the next 18 months. 

Some of this capital reduction may be due to loan write-downs but the vast majority will be due to repayments.  There are substantial mortgage arrears problems in Ireland, but it must also be remembered that substantial mortgage payments are also being made.  The Financial Regulator’s data show that nearly 90% of mortgages are neither in arrears or restructured.

Over the 18-month period in question here, the household sector had a gross savings rate of around 10% and had about €15 billion in gross savings.  As we have said before most of that is going to pay down debt rather than increase deposits.  And as shown here a lot of that debt repayment is going to pay down mortgages.  I would guess that around €5 billion of mortgage capital repayments are being made per annum.

Looking briefly at the number of mortgages.  In September 2009 there were 794,609 mortgages outstanding.  By March 2011 this had fallen by more than 12,000 to 782,429. 

Mortgages to first time buyers are definitely an increase in the number of mortgages.  We will take it that there is no increase in the number of mortgages as a result of mover purchasers. Remortgages and top-ups do not change the number of mortgages.  There were nearly 15,500 mortgages given to first-time buyers between the two dates in questions.

An arrears rate of 6.3% (which is only going to increase in the medium term) is signal enough that there are significant problems in the mortgage market.  Any proposed solution should be targeted at this problem as the majority of people are still meeting their mortgage obligations.

Friday, August 19, 2011

Another day, another drop in yields

The 10-year yield on Irish government bonds dropped below 9.5% today.

Bond Yields 1D 19-08-2011

We can’t be sure what this happened and it could be the result of artificial intervention by the ECB.  I not sure and really can’t see the value of the ECB buying government bonds for a country that is already in a rescue programme.  It could be like this report back in July which stated that it was “real money” coming back into the market.

Here is the full list of all outstanding bonds at the close of business today.  Click to enlarge.

Outstanding Bonds 19-08-11

There is now no Irish government bond yielding more than 10%.  It is clear that concerns about out funding after the current EU/IMF programme expires have eased considerably.  The D-Day bonds maturing on the 14th January 2014 are now yielding 9%.

Jumbo Mortgages. Take Two.

These issue of €1 million+ mortgages is back in the news today following a presentation by Prof Morgan Kelly to the Irish Society of New Economists yesterday.  He first made the claim of 10,000 million plus mortgages in his Hubert Butler lecture in Kilkenny two weeks ago and which was examined on this site here and I also have a piece here.

An article in today’s Irish Times provides a fresh defence of the claim.

Yesterday he told a meeting of the Irish Society of New Economists in Dublin that this “anecdote” had “taken on a life of its own”.  He had been called “irresponsible” for using it.  “I read this in a newspaper a year ago, it has to be true,” he joked.

Prof Kelly said he had since used econometric calculations to analyse how many of these large investment mortgages there were, concluding that the anecdote “seems to be correct”.

Yesterday he said the investors probably took out more than one mortgage so it was 10,000 mortgages not 10,000 people who owed €11 billion.

Prof Kelly also calculated that two-thirds of investor loans were interest-only.  “These interest-only loans seem to concentrate among investors, and my guess would be this is large properties.”  This large number of interest-only investor mortgages was “ bad news” for the Irish banking system and the taxpayers, he said yesterday.

These investors “typically bought property that was designed for investors”.  Prof Kelly predicted “very large losses” on these properties.  Demand for property was driven by the flow of lending from banks. “The flow of lending to these investors is only 1 per cent of what it was back at the peak,” he said.

“There is no demand for this stuff, so I think there is going to be very large losses on these things.

This time the focus is on investment or buy-to-let mortgages.  In most cases the most important demand for these properties is in the rental rather than real estate market.  There may be some investors who bought investment properties for resale but the majority would have been bought to rent.

The most recent Daft report indicates that rents have fallen by an average of 25% since 2007.  This would be bad news for investors but it is cancelled by the drop in interest rates, particularly tracker rate mortgages. 

The key ECB rate has fell from 4.25% in July 2008 to 1.00% in May 2009.  It now stands at 1.50%.  This is still lower than at any time during the 2002 to 2007 period.  Recent indications are that further rate increases by the ECB will be put on hold. 

If two-thirds of these loans are interest only as claimed then the repayments on these loans will have fallen by more than the drop in rent.

We can get an insight into the residential investment market in Ireland from an interview  in The Irish Examiner with Hubert Kearns, chairman of the project agency which handles the collection of the Non-Principal Primary Residence charge of €200 on behalf of the country’s local authorities.  This includes all second properties and not just those for investment.

One of the most surprising features of the new tax regime was the level of compliance, about 80%, for the self-declaration tax on non-principal private residence (NPPR).

"There was a very high level of compliance by people before the due date both last year and this year. Another thing that surprised us is that there is a very large number of individuals who own a sizeable number of properties.
"There are 99,000 people with one property, but there are 35,000 people who have between two and 10 properties and who have paid the charge on two to 10 properties. In effect, this means of course that they own between three and 11 properties.

"And the figures go up, 970 people have between 12 and 21 properties; 230 people have between 22 and 31 properties and 100 people have between 32 and 41 properties."

Although there are 35,000 people who have paid the charge on between two and 10 properties, it is likely that most of these are in the range of two to four and are unlikely to have mortgages of more than €1 million.  Still there could be a couple of thousand people with five to 10 properties.

There is 1,300 people who paid the charge on more than 10 properties.  There is no doubt that a sizeable proportion of this group could have one (or more) mortgages in excess of €1 million.

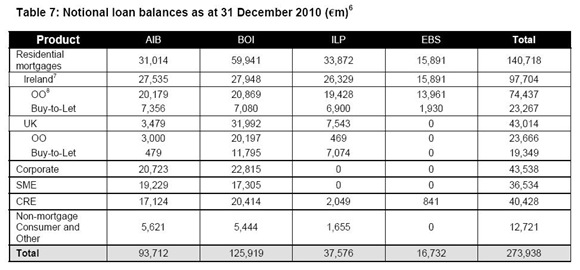
If we look at the banks we see that the covered banks had a buy-to-let loan book of around €24 billion as reported in the stress tests.  The loan balances for AIB, BOI, PTSB and EBS are summarised in this table.  There was also about €600 million of buy-to-let loans in INBS.  Click to enlarge.

Loan Balances

Of the total buy-to-let loan book of €24 billion it is hard to imagine that €11 billion would be concentrated in fewer than 10,000 people.  It could be the case though.

The stress tests allow for €6.3 billion of loan losses in buy-to-let loans.  The “three-year loss provision” of the Central Bank means that capital was provided for around €3.5 billion of losses between now and 2014.

Unlike owner-occupied mortgages we do not get data from the Financial Regulator on arrears for buy-to-let loans.  The banks themselves have given us an insight into this. It’s not pretty.  When announcing their half-year results AIB said.

One in five of its 44,000 Irish buy-to-let mortgages was in arrears or had been restructured to help borrowers at the end of June, compared with one in 12 of the bank’s 126,000 home loans.

The stress test loss of €6.3 billion in the adverse scenario would require about €12 billion of defaults in buy-to-let mortgages assuming that, on average, the property repossessed is worth 50% of the loan value.  That is a default on half the loan book.

The buy-to-let loan book is a mess but we still lack evidence that these 10,000 jumbo loans exist.

UPDATE: This morning we have had some useful information on whether the banks have 10,000 mortgages of more than €1 million on their books.  The numbers come from the Askaboutmoney.com website and can be seen here.  A fairly robust defence of the numbers was provided over on Namawinelake in this comment.

The numbers provided by the banks seem more realistic to me.  Although it seems to be “sources within the banks” rather than an official publication, the evidence is that the covered banks have about 2,500 mortgages on their books of more than €1 million.  This includes owner-occupied AND buy-to-let mortgages.

If 20% of these loans defaulted the banks are looking at losses of around €250 million.

Thursday, August 18, 2011

Household Borrowings, Repayments and Debt Forgiveness

There is no doubt that the credit market has slowed to a virtual standstill in Ireland.  This was further emphasised by the mortgage data that was released by the Irish Bankers Federation during the week.  Here are the amounts of mortgages issued since 2005.

Mortgage Lending

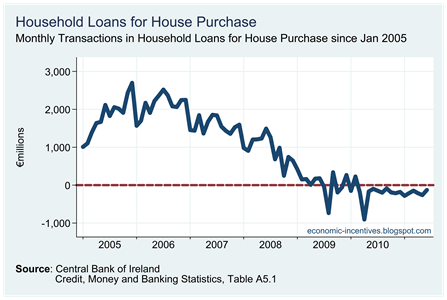
In the the second quarter of 2011 just €624 million of mortgage lending took place.  This is gown over 90% from the peaks since in 2006.  This pattern is reflected if we look at the monthly mortgage transactions of the banks’ balance sheets from the Money, Credit and Banking Statistics produced by the Central Bank.

Household Loans for House Purchase (Transactions)

The huge monthly increases up to 2007 are evident.  For more recent times it should be noted that the monthly transactions for mortgages on the banks’ balance sheets are negative.  For the second quarter of 2011 these summed to around €600 million.

Given the new mortgage lending that was issued it is probable that the balance of loans that existed at the start of Q2 2011 fell by around €1 billion during the quarter.  It is also likely that most of this is due to repayments rather than write-downs.  Irish households might have huge amounts of debt but in most cases it is being repaid.

Although we only have figures to the end-of March, the mortgage arrears data from the Financial Regulator show that entering Q2 2011, nearly 90% of all mortgages were being paid according to the terms of the original contract.  Some of these may actually be being repaid quicker than the agreed schedule.

This level of repayment is being reflected in the Quarterly Household Sector Accounts also produced by the Central Bank.  Here are the loans of the Household Sector in those accounts.

Household Loans

Again, the rapid rise in indebtedness is evident, but it is clear than since peaking in 2008 household debt liabilities have been decreasing.  This is because repayments on existing loans is greater than the amount of new loans issued. 

Long-term loans make up 95% of the total with about two-thirds of that again being mortgages for owner-occupied houses.  The same mortgage arrears data linked above show that there were €116 billion of owner-occupied mortgages in Ireland.

Household loans peaked at €203.3 billion in the 4th quarter of 2008.  By the first quarter of 2011 this had fallen to €184.9 billion.  The figures above suggest that this fall continued into the second quarter. Even still the level of household debt in Ireland is significantly above international norms, but it is falling.

There are massive debt problems, private and public, in Ireland.  Most of household debt can be repaid.  Some of it will never be repaid, and this could run to many billions – but maybe the problem is “not enormous ”.

A DEBT forgiveness scheme to relieve homeowners in mortgage distress would cost “in the region of €5-€6 billion”, UCD professor of economics Morgan Kelly has said.

While I am not a fan of widespread debt-forgiveness it is useful to note that the stress tests from last March allowed for about €6 billion of losses over the next three years in the covered banks on owner-occupied mortgages.   Although the precise details are not provided the scheme could be funded with the money already provided to the banks.

Maybe we should keep Prof. Kelly in this relatively good mood but I wonder what will happen when he learns that there is €116 billion of owner-occupied mortgages in Ireland rather than “about €55 billion”.  About two-third of this €116 billion are in the covered banks.

UPDATE: Here are more details of the scheme proposed by Prof Kelly.

“The good news is that if you leave investment mortgages out [of total mortgages owed], which are largely the banks’ problem, and look at mortgages people have on their own houses, there are about €55 billion of these out there,” he said.

“A lot of people can’t repay these mortgages and this is causing people terrible agony,” he said.

Prof Kelly made his estimations based on 20 per cent of people having difficulty paying their mortgages. This was the default figure in Florida where there was a similar housing bubble, he said. He estimated that mortgages would need to be halved on average.

“I would reckon that the ultimate cost of this very useful social programme is something in the region of €5 billion to €6 billion.”

I don’t know where the €55 billion figure came from.  The mortgage arrears data from the Financial Regulator show that there was almost €116 billion outstanding across the 782,00 of owner-occupied mortgages in Ireland at the end of March 2011.

If it is expected that 20% of people will get into difficulty, than that is around 150,000 mortgages.  If these people have have an average mortgage of €200,000 then the forecast is there will be €30 billion of mortgages in difficulty.  Reducing these mortgages by half would cost €15 billion.  This is two-and-a-half times greater than the suggested cost of €6 billion.

There is a bit more on mortgage debt forgiveness in this post.

DBRS downgrades Ireland to A(low)

Yesterday, the Canadian rating agency, Dominion Bond Rating Service or DBRS downgraded Ireland from A to A(low).  The ratings used by DBRS can be viewed here.  Just six weeks DBRS had confirmed Ireland A rating and suggested it was “unlikely to downgrade Ireland”.

However the A(low) rating from DBRS is four grades above speculative or "junk" status and remains Ireland's highest rating among the four leading ratings agencies.  As we know both S&P and Fitch have Ireland three notches above junk with their rating of BBB+, while Moody's lowered Ireland's rating one notch below the junk status threshold to BB+ in early July.

We previously looked at S&P’s recent statement on Ireland and their forecasts of Ireland’s “net government debt including NAMA obligations”.  To make comparisons different DBRS focus on “gross government debt excluding NAMA” but they have the following to say:

In our revised baseline scenario, Ireland’s gross general government debt peaks at 120% of GDP in 2013 and gradually declines thereafter. This excludes NAMA bonds and its associated assets.

Although difficult to draw exact comparisons there is agreement that Ireland’s debt ratios will peak over the next few years.  The full DBRS statement can be read here

One benefit of maintaining the A rating with DBRS on Irish government bonds for our ailing banks is highlighted here.

When Moody’s downgraded Ireland to junk status on the 12th of July their statement clearly stated that the basis for the decision was the belief that “private sector creditor participation will be required as a precondition for additional support” from the EU/IMF. 

When emerging from the crisis summit nine days later Michael Noonan clearly stated that there would be no such pre-conditions as long as Ireland was meeting the terms of the original agreement.  Moody’s themselves admit that Ireland has met, and in some cases exceeded, the targets laid out in the EU/IMF programme.  In the light of recent developments the Moody’s downgrade to junk status does not seem warranted.

In fact if Moody’s were to listen to the views of Fitch just a few days earlier they may not have gone as far.  In a comment the following is stated.

Ireland is unlikely to default on its debt, Chris Pryce, a sovereign credit analyst with Fitch Ratings, said today.

“Our ratings, which are investment grade reflect the view that we certainly don't believe that Ireland is likely to default,” Pryce said in a telephone interview today. Fitch has a BBB+ rating on Ireland.

Tuesday, August 16, 2011

One month of bond yields

Here is just a quick snapshot of Irish ten-year government bond yields as calculated by Bloomberg for the past month.

Bond Yields 1M to 17-08-11

This graph starts on Monday 18th July when the yield peaked at 14.1%.  The yield dropped in the run up to the eurozone summit in Brussels on Thursday 21st July and then fell on virtually every day for the next three weeks.  The yield dropped below 10% on Monday 8th August and has stayed below that level ever since.

Keeping below 10% is not an indicator that the crisis is over; far from it.  There is still a long way to go, and there are many potential pitfalls that could hinder our return to borrowing from these markets (which would require the yield to drop to 6% and lower) but it is a move in the right direction.

10,000 mortgages

In his Hubert Butler Lecture delivered in St. Canice’s Cathedral, Kilkenny on Saturday 6th August as part of the Kilkenny Arts Festival, Professor Morgan Kelly made reference to 10,000 interest-only mortgages of between €1-2 million. 

Here is the actual quote (which is from about 31:35 in the audio file posted here)

“What worries me increasingly are mortgages, and in particular there is a group of mortgages given out - interest only mortgages - that were given out to professionals; to lawyers, solicitors, estate agents, at the peak of the bubble. And about 10,000 of these were given out, and this seems trivial, there are three quarters of a million mortgages out there, why should we care about 10,000 of them?  However, it turns out that these mortgages were for properties of €1-2 million each. So these guys would put up like 20% of the price, so 10,000 of these loans of €1.1 million each, which means that there’s like €11 billion in loans to these high-rollers from the boom, most of whom could barely buy you a cup of coffee now.”

Kelly forecasts that that banks would be lucky get back half of €11 billion issued on these loans and predicts a total of €30 billion of additional losses in the banks on top of what has already been accounted for already.  Following the huge economic disasters of the last few years this would be the one to push us over the edge, if it comes to pass.

The relatively good news is that there is no evidence that these 10,000 loans of a million plus actually exist.   On the other hand there is also no evidence that these 10,000 loans do not exist.  They might be out there, or they might not. We just don’t know.

Kelly based his statement on a May 2010 press release from the Irish Brokers Association (IBA) which made reference to this number.  I was in contact with the IBA last week and Ciaran Phelan sent an explanatory email. See here.

In the email it is explained that:

As no exact figures are available ( which I believe they should be) we could only estimate the numbers involved which we did using data from Moody's, Central Bank and our own internal conversations with members involved in the mortgage area who have considerable expertise in mortgage lending.

It is very likely that the The Sunday Independent  made the same enquiries and received the same email.  They carried a front-page story and a longer article that seemed to make a good deal more of the email than might be expected.

There were some misgivings that Morgan Kelly’s claims were based on an article from by Jack Fagan in The Irish Times on the 6th May 2010 (ungated version here).  However, when I went searching for a reference to these 10,000 loans, I first came across them in an article by Charlie Weston in The Irish Independent!  This article was published on the 30th April 2010, almost a full week before the same details appeared in The Irish Times.

The Sunday Independent article attempted to use Stamp Duty data from the Revenue Commissioners to counter the claim that these 10,000 €million plus mortgages exist.  This is inconclusive as the register of transactions included for Stamp Duty is not the full list of all mortgage transactions that occur. 

The Stamp Duty numbers show that between 2004 and 2007 around 13,000 stamped transactions took place on properties with prices of more than €635,000.   Using this number it is hard to imagine that 10,000 million plus mortgages are in existence.

The problem with using the Stamp Duty data in this manner is that while there was over 50,000 property transactions with Stamp Duty in 2006, there were over 200,000 mortgage transactions.  Stamp Duty only covers about a quarter of all mortgage transactions.

In my opinion it is very unlikely that there were 10,000 interest-only mortgages of more than €1 million given to professionals at the peak of the boom.  There is no evidence that they exist, but neither is there sufficient evidence to say that they don’t.  For the moment let’s assume that they do exist.  

Even if these mortgages were issued it is certain that only a fraction, rather than all, of them are in arrears.  With the typical tracker-rate mortgage that was available at the time, the annual interest bill on a mortgage of just over €1 million would be around €30,000 or less.  Even with the recent downturn this would be a manageable burden from the incomes of most professionals. 

Although no figures are available, there is no reason to expect mortgage arrears on these specific loans to be substantially higher than the average for all mortgages.  The Financial Regulator reports that nearly 90% of all mortgages are being repaid according to original contract, while 94% have avoided going into arrears of more than 90 days.

If we take it that these 10,000 mortgages are a special case and assume that 25% will default.  The banks will be have to write-down a loan of around €1.1 million but will take ownership of the house, which with a 60% price drop, would be worth around half a million.  In this very adverse scenario there is likely to be a loss of around €1.25 billion.

It is also important to realise that there is no certainty that all of these loans, such that they exist, were issued by the “covered” banks, most of which have now been nationalised.

Although not proven by the Stamp Duty statistics, it is likely that the actual number of million plus mortgages is lower than the 10,000 figure used by Kelly.  Looking at the aggregate mortgage data it could be less than half of this figure.  This is as much of a guess as the original estimate provided by the Irish Brokers Association but guessing seems to be the order of the day.  If we apply a more realistic default rate of 10% to this estimate, then the losses for the banks will be around €300 million. 

This is nearly 20 times lower than the €5.5 billion if there were to 10,000 defaults and such a loss was more than provided for in the bank stress tests published at the end of March.   The banks can handle €300 million of losses on jumbo mortgages.  If it comes to it they can handle €1 billion of losses on jumbo mortgages. 

It is possible that some of these loans do not appear in the mortgage statistics as they could be structured as commercial loans through a professional’s business.  For the present analysis we will stick with mortgages.

The stress tests allowed for €9.5 billion of residential mortgage losses over the next three years. That would probably require something around €16 billion of mortgage defaults.

The four main covered banks (AIB, BOI, EBS and PTSB) had €97 billion of residential mortgages at end-2010 (€74 billion in owner-occupied mortgages and €23 billion buy-to-let mortgages). A default rate of 17% over the next three years is allowed for in the stress tests.

If the losses to the covered banks on these 10,000 loans were €1 billion this would be easily absorbed into the €9.5 billion allowed for in the stress tests and there would still be nearly 90% of the loss provision available for the other 90% of mortgages.  

We cannot be sure if these loans exist or not.  For the wider economy it would probably be a good thing if they did exist.  The Financial Regulator report shows that there was €116 billion outstanding at the end of March 2011 on the 782,000 mortgages covered in its mortgage arrears data.  This gives an average mortgage balance of €148,200

If just 10,000 loans account for €11 billion of the total, then the average balance on the remaining 99% is actually €135,900.  With 10% of the burden carried by so few people, the average burden across everyone else is much lower.  The notion of “average burden” means nothing for someone who has lost their job and is trying to service a €300,000 mortgage but the exercise does give caution when using the aggregate figures.

As for these 10,000 mortgages – it really is hard to know.  It will take actual data from the banks to prove or disprove their existence.  Even if they are on the books of the banks it is hard to imagine that they will necessitate the banks getting additional capital. 

There may be other skeletons remaining on the banks’ balance sheets but this is not one of them.  BlackRock Consultants were paid plenty of money to  analyse the banks’ loans books so it is unlikely they would have missed these mortgages.  This was an interesting anecdote to provide to an audience at an Arts Festival lecture but is by no means another nail in the economy’s coffin.
Thursday, August 11, 2011

Reduced VAT and price changes

The July CPI is also the first the picks up the effect of the reduced VAT rate of 9% on the supply of certain goods and services. Details here.  We can use the CPI Detailed Sub-Indices to gauge some of the effect of the VAT reduction. The results are mixed.

VAT Price Changes

The price changes vary from a 4.1% drop in the price of newspapers (the full VAT reduction was passed on) to a 0.9% increase in the price of accommodation services.  Prices for cinema and hairdressing dropped by around 2%, with the cost of eating, canteens and takeaways all falling by less than 1%. 

Although the reduced rate of VAT is supposed to apply to cultural admittance and sports participation the price of both was unchanged in the month, though their prices are down more than 5% on the year.

All told, the categories listed here fell by 0.79% in the month and contributed to a monthly fall of less than 0.1% in the overall CPI.  Outside of newspapers it is hard to find significant evidence of the VAT reduction feeding through to price reductions.

Core inflation edges down

According to the July release of the CSO’s Consumer Price Index the headline rate of inflation stayed at +2.7% for the third month in a row. Prices on the month were unchanged.  Our measure of “core” inflation (the 85% of the index excluding energy products and mortgage interest) slipped down on the month.

Core Inflation July 2011 

Core inflation slipped from +0.5% in June to +0.39% in July.  Of the headline rate of 2.7%, 1.4 percentage points or more than half, is contributed by mortgage interest.  Energy products contributed 0.9 percentage points to the headline rate.

Tuesday, August 9, 2011

Yields finish at 9.5%

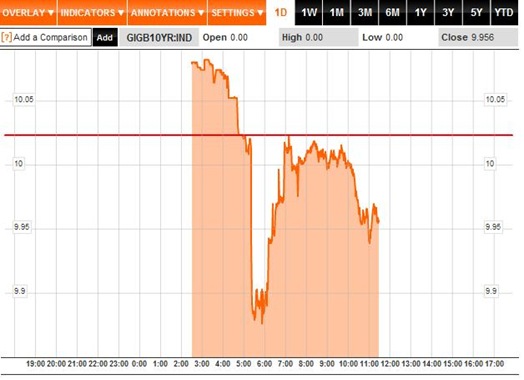
On a day when European equity markets bounced around all day, it seemed that Irish bond yields were going to spend the day in relative tranquillity.  That was until just before 3pm when a rapid drop over a 20-minute period saw the yield drop from 9.9% to 9.5%, where they finished.

Bond Yields 1D 09-08-2011

It is not clear why this happened.  It could be an intervention by the ECB engaging in some bond buying late in the day.  There are now just two Irish bond issues yielding more than 10%.  These are the April 2013 and January 2014 bonds.  All longer dated bonds are yielding less than 10%.  Click to enlarge.

 Outstanding Bonds 09-08-11

Monday, August 8, 2011

Back in single digits

It is important to realise that it is only a constructed number but it somewhat noteworthy that the 10-year yield calculated by Bloomberg for Irish government bonds has dipped below 10% today.  This is the first time this has happened since the fall in yields in the aftermath of the publication of the bank stress test results on the 31st March.

Here is the daily chart.

Bond Yields 1D 08-08-2011

Here are today’s actual closing prices and yields for all Irish government bonds from the NTMA daily report.  Click to enlarge.

Outstanding Bonds 08-08-11

Developments elsewhere are rightly dominating.  Spanish and Italian bond yields are down dramatically on the day.  Ireland is just a bobbing cork in a very choppy sea.

Saturday, August 6, 2011

Interest Rates on our Public Debt

As it stands Ireland’s public debt is made up of five distinct types (estimated size at 30th June 2011)

  1. Government Bonds (€89.7 billion)
  2. Retail Debt (€13.7 billion)
  3. EU/IMF & Bi-lateral Loans (€22.4 billion)
  4. Promissory Notes (c. €28 billion)
  5. NAMA Bonds (c. €28 billion)

These all come with different costs and interest rates.  The interest coupons on the €89.7 billion of outstanding bonds can be seen here and ranges from 3.9% to 5.9%.  The retail debt pays prizes to winners in the case of Prize Bonds and fixed interest rates in the case of Savings Certificates and Bonds.

The concern here is with the costs of items three and four.  Here is a very useful table which was provided via an interested reader. (HT: Kevin).  This table shows the drawdown amounts and interest rates on the EU/IMF loans at the end of June.

EU IMF Interest Rates

The outcome of the Brussels summit on the 21st July was that our borrowings under the EFSF would be reduced to something close to 4%.  As we can see from the above table we have drawn down around €3.6 billion at an interest rate of 5.9%.  In total we are due to borrow €17.7 billion from the ESFS so there will be some savings. 

It remains to be seen if the interest rate reduction will also apply to our borrowings from the EFSM.  As we can see above these funds carry on interest rate of up to 6.48%.  Under the programme it is expected that we will borrow €22.5 billion from the EFSM so substantial savings will be earned if (or when) the reduced interest rate is applied.

The other €4.8 billion of the €45 billion in loans from the EU is being arranged through bi-lateral agreements with individual countries and we already know that the UK has committed to reducing the rate on the loan it is providing.  It is not expected that there will be any change on the €22.5 billion of loans from the IMF.

Yesterday’s statement from S&P takes account of this uncertainty.

Following the Heads of State or Government of the Euro Area and EU Institutions statement of July 21, 2011, we expect the interest rate on the European Financial Stability Facility portion (€17.7 billion) of Ireland's €67.5 billion external support package to decrease to about 4.5%, from about 6.0%. We estimate the saving to the Irish government on interest payments will be around €0.9 billion (0.6% of GDP) cumulatively over 2012-2015. The maturities on EFSF loans are also expected to be lengthened as part of the Heads of State agreement. Meanwhile, it is also possible that interest rate reductions will be extended to Ireland's European Financial Stability Mechanism (€22.5 billion) and bilateral borrowings (€4.8 billion).

When thinking about these rate reductions a sudden thought flashed across my mind that maybe these would have some impact on the interest rate charged on the Promissory Notes provided to Anglo and INBS.  I briefly hoped that the interest rate might be calculated from some blended average of other government borrowing rates.  Hopes were soon dashed.  From the Information Note provided by the DoF last November.

The interest rate charged is based on the long term Government bond yield appropriate to when the amounts will be paid.

The interest rate on the Promissory Notes has nothing to do with government interest costs but is directly related to the yields on governments bonds in the secondary market.  Pretty quickly my hope had turned to fear.  These are not very low.

Information provided by the DoF shows the interest rates chargeable on the Promissory Notes.  This is not new information and was provided by the then Minister for Finance, the late Brian Lenihan, back in January.  See here.

Promissory Notes Interest Rates

The interest rate on the first three tranches is not out of line with our other borrowings.  However, the €9.1 billion that makes up tranche four has an annual coupon equivalent to 8.6%.  This is by far our most expensive debt.

We were up in arms at the 6% being charged to us by our EU partners, but we ourselves are paying nearly 9% to the two zombies that now make up the Irish Bank Resolution Corporation (IBRC).

We have been told that this new entity will not need any further capital injections from the State.  This must be considered in the light of the €17 billion interest cost the Promissory Notes will impose on us during their lifespan.  This is an implicit injection by the State.

Should we just payoff this €9 billion of 9% Promissory Notes with extra money borrowed at 4% from the EFSF?  This would generate an annual interest saving of around €350 million.  Of course we would actually have to pay the interest if we borrowed it from the EFSF rather than just rolling it up as accrued interest in the Promissory Notes.

This would eliminate the possibility of ever reneging on this portion of the Promissory Notes, but according to the current Minister for Finance we have no intention of doing so anyway.

Ireland’s Public Debt – Again!

Yesterday’s statement from S&P outlining why they were maintaining Irish government bond’s BBB+ investment grade contained the following paragraph.

We expect Ireland's net general government debt burden will peak at about 110% of GDP in 2013, including NAMA's debt obligations, before falling to about 103% of GDP in 2015. Excluding NAMA obligations, we expect net debt to peak at around 97% of GDP in 2014.

How does this fit with other forecasts of Ireland’s public debt?

The first thing to note is that it is important to define what measure of public debt is being forecasted.  This site has focussed on forecasts of Ireland’s General Government Debt (GGD).

At the end of 2010 Ireland’s GGD was €148 billion.   I have previously forecast that this will be around €208 billion at the end of 2014.  The €60 billion increase comprised €50 billion for the cumulative deficits and borrowings of €10 billion to fund the €20 billion recapitalisation of the banks.  We now have two reasons to revise this estimate down.

  1. Reduced interest rate on EU loans from 6% to 4.5%
  2. Reduced bill from recapitalisation from €20 billion to €18 billion.

Although the full interest cost reductions have yet to be determined there will definitely be a cumulative gain of around €1 billion to the end of 2014.  If the reduced interest rate is applied to all EU loans the benefit could approach €3 billion. 

With a €2 billion saving on the bank recapitalisation, it is not unreasonable to now forecast that Ireland’s General Government Debt in 2014 will be around €205 billion. 

To calculate the debt/GDP ratio we need a forecast of Ireland 2014 nominal GDP.  In 2010 this was €156 billion.  The IMF projection is that Ireland’s nominal GDP will be €174 billion in 2014.  We do not know what figure S&P used in the denominator.

That would leave the ratio of GGD to GDP at 118%.  How does this compare with the S&P projection that, excluding NAMA, Ireland will have a “net debt” of 97% of GDP in 2014?

Although S&P do not detail how they reach a net debt figure there are a number of things we can subtract from the GGD to get a measure of net debt.  These include:

  1. Cash balances, of c. €16 billion at the end of 2010
  2. Remaining assets in the NPRF after recapitalisation, c. €5 billion
  3. Resale value of nationalised banks,  €unknown

If we subtract the known assets of €21 billion held by the state we get a net debt of €184 billion and a net debt ratio of 106%, still some way above the 97% forecast offered by S&P.

Our cash balances and NPRF assets will hopefully generate a positive return which would have increased the above values by the end of 2014.  There is also the possibility that S&P are subtracting the €3 billion of “contingent capital” that is being provided to the banks now but which is due to be returned to the State in 2014.   Including these, as well as guesstimating some value for the banks, it is not difficult to imagine that a net debt calculation showing 97% could be produced.

The problem with using net debt calculations is the differences that arise in choosing what elements to subtract to reach the appropriate net debt figure.  S&P may have been a little generous in the elements they included but suggesting a 97% net debt figure is not completely unrealistic.  In this context a net debt figure, including NAMA obligations, of 110% is not without some merit either.

Personally, I’d prefer to stick with a debt forecast of a measure that is clearly defined.  In that light a forecast of a 2014 GGD of €205 billion works best.  This would edge towards €200 billion if the expected interest savings on the full €45 billion of EU loans materialises.  Further details of this forecast can be found in this note which was written around the start of May. 

Calculations subtracting €16 billion of cash, €5 billion of NPRF assets, resale values of banks and €3 billion of contingent capital can be undertaken, but in the absence of a common net debt definition comparing across them is difficult.

Even with this forecast reduction in our GGD to around €205 billion we are still facing into a headwind, but at least now the wind speed has started to drop a knot or two.

S&P downgrades US bonds to AA+

After a day of speculation Standard and Poor’s have officially downgraded US government debt from the top rating AAA to AA+.  Here is the full list of S&P ratings.  Everything from BBB- up is considered investment grade, with ratings from BB+ down given speculative or junk status.

Ratings

Yesterday, S&P confirmed Ireland investment grade status of BBB+.  Here are the bullet points that accompanied the S&P statement. (The full statement is reproduced below the fold.)

  • We have lowered our long-term sovereign credit rating on the United States of America to 'AA+' from 'AAA' and affirmed the 'A-1+' short-term rating.
    We have also removed both the short- and long-term ratings from
    CreditWatch negative.
  • The downgrade reflects our opinion that the fiscal consolidation plan that Congress and the Administration recently agreed to falls short of what, in our view, would be necessary to stabilize the government's
    medium-term debt dynamics.
  • More broadly, the downgrade reflects our view that the effectiveness, stability, and predictability of American policymaking and political institutions have weakened at a time of ongoing fiscal and economic challenges to a degree more than we envisioned when we assigned a negative outlook to the rating on April 18, 2011.
  • Since then, we have changed our view of the difficulties in bridging the gulf between the political parties over fiscal policy, which makes us pessimistic about the capacity of Congress and the Administration to be able to leverage their agreement this week into a broader fiscal consolidation plan that stabilizes the government's debt dynamics any time soon.
  • The outlook on the long-term rating is negative. We could lower the long-term rating to 'AA' within the next two years if we see that less reduction in spending than agreed to, higher interest rates, or new fiscal pressures during the period result in a higher general government debt trajectory than we currently assume in our base case.

There was some debate that the figures used by S&P t0 justify the downgrade were incorrect.  S&P came out and admitted that the numbers were wrong but argued that the revision did not change their overall view.  See clarification statement here.

The full S&P statement on the US downgrade is below the fold.

TORONTO (Standard & Poor's) Aug. 5, 2011--Standard & Poor's Ratings Services said today that it lowered its long-term sovereign credit rating on the United States of America to 'AA+' from 'AAA'. Standard & Poor's also said that the outlook on the long-term rating is negative. At the same time, Standard & Poor's affirmed its 'A-1+' short-term rating on the U.S. In addition, Standard & Poor's removed both ratings from CreditWatch, where they were placed on July 14, 2011, with negative implications.

The transfer and convertibility (T&C) assessment of the U.S.--our assessment of the likelihood of official interference in the ability of U.S.-based public- and private-sector issuers to secure foreign exchange for debt service--remains 'AAA'.

We lowered our long-term rating on the U.S. because we believe that the prolonged controversy over raising the statutory debt ceiling and the related fiscal policy debate indicate that further near-term progress containing the growth in public spending, especially on entitlements, or on reaching an agreement on raising revenues is less likely than we previously assumed and will remain a contentious and fitful process. We also believe that the fiscal consolidation plan that Congress and the Administration agreed to this week falls short of the amount that we believe is necessary to stabilize the general government debt burden by the middle of the decade.

Our lowering of the rating was prompted by our view on the rising public debt burden and our perception of greater policymaking uncertainty, consistent with our criteria (see "Sovereign Government Rating Methodology and Assumptions ," June 30, 2011, especially Paragraphs 36-41). Nevertheless, we view the U.S. federal government's other economic, external, and monetary credit attributes, which form the basis for the sovereign rating, as broadly unchanged.

We have taken the ratings off CreditWatch because the Aug. 2 passage of the Budget Control Act Amendment of 2011 has removed any perceived immediate threat of payment default posed by delays to raising the government's debt ceiling. In addition, we believe that the act provides sufficient clarity to allow us to evaluate the likely course of U.S. fiscal policy for the next few years.

The political brinksmanship of recent months highlights what we see as America's governance and policymaking becoming less stable, less effective, and less predictable than what we previously believed. The statutory debt ceiling and the threat of default have become political bargaining chips in the debate over fiscal policy. Despite this year's wide-ranging debate, in our view, the differences between political parties have proven to be extraordinarily difficult to bridge, and, as we see it, the resulting agreement fell well short of the comprehensive fiscal consolidation program that some proponents had envisaged until quite recently. Republicans and Democrats have only been able to agree to relatively modest savings on discretionary spending while delegating to the Select Committee decisions on more comprehensive measures. It appears that for now, new revenues have dropped down on the menu of policy options. In addition, the plan envisions only minor policy changes on Medicare and little change in other entitlements, the containment of which we and most other independent observers regard as key to long-term fiscal sustainability.

Our opinion is that elected officials remain wary of tackling the structural issues required to effectively address the rising U.S. public debt burden in a manner consistent with a 'AAA' rating and with 'AAA' rated sovereign peers (see Sovereign Government Rating Methodology and Assumptions," June 30, 2011, especially Paragraphs 36-41). In our view, the difficulty in framing a consensus on fiscal policy weakens the government's ability to manage public finances and diverts attention from the debate over how to achieve more balanced and dynamic economic growth in an era of fiscal stringency and private-sector deleveraging (ibid). A new political consensus might (or might not) emerge after the 2012 elections, but we believe that by then, the government debt burden will likely be higher, the needed medium-term fiscal adjustment potentially greater, and the inflection point on the U.S. population's demographics and other age-related spending drivers closer at hand (see "Global Aging 2011: In The U.S., Going Gray Will Likely Cost Even More Green, Now," June 21, 2011).

Standard & Poor's takes no position on the mix of spending and revenue measures that Congress and the Administration might conclude is appropriate for putting the U.S.'s finances on a sustainable footing.

The act calls for as much as $2.4 trillion of reductions in expenditure growth over the 10 years through 2021. These cuts will be implemented in two steps: the $917 billion agreed to initially, followed by an additional $1.5 trillion that the newly formed Congressional Joint Select Committee on Deficit Reduction is supposed to recommend by November 2011. The act contains no measures to raise taxes or otherwise enhance revenues, though the committee could recommend them.

The act further provides that if Congress does not enact the committee's recommendations, cuts of $1.2 trillion will be implemented over the same time period. The reductions would mainly affect outlays for civilian discretionary spending, defense, and Medicare. We understand that this fall-back mechanism is designed to encourage Congress to embrace a more balanced mix of expenditure savings, as the committee might recommend.

We note that in a letter to Congress on Aug. 1, 2011, the Congressional Budget Office (CBO) estimated total budgetary savings under the act to be at least $2.1 trillion over the next 10 years relative to its baseline assumptions. In updating our own fiscal projections, with certain modifications outlined below, we have relied on the CBO's latest "Alternate Fiscal Scenario" of June 2011, updated to include the CBO assumptions contained in its Aug. 1 letter to Congress. In general, the CBO's "Alternate Fiscal Scenario" assumes a continuation of recent Congressional action overriding existing law.

We view the act's measures as a step toward fiscal consolidation. However, this is within the framework of a legislative mechanism that leaves open the details of what is finally agreed to until the end of 2011, and Congress and the Administration could modify any agreement in the future. Even assuming that at least $2.1 trillion of the spending reductions the act envisages are implemented, we maintain our view that the U.S. net general government debt burden (all levels of government combined, excluding liquid financial assets) will likely continue to grow. Under our revised base case fiscal scenario--which we consider to be consistent with a 'AA+' long-term rating and a negative outlook--we now project that net general government debt would rise from an estimated 74% of GDP by the end of 2011 to 79% in 2015 and 85% by 2021. Even the projected 2015 ratio of sovereign indebtedness is high in relation to those of peer credits and, as noted, would continue to rise under the act's revised policy settings.

Compared with previous projections, our revised base case scenario now assumes that the 2001 and 2003 tax cuts, due to expire by the end of 2012, remain in place. We have changed our assumption on this because the majority of Republicans in Congress continue to resist any measure that would raise revenues, a position we believe Congress reinforced by passing the act. Key macroeconomic assumptions in the base case scenario include trend real GDP growth of 3% and consumer price inflation near 2% annually over the decade.

Our revised upside scenario--which, other things being equal, we view as consistent with the outlook on the 'AA+' long-term rating being revised to stable--retains these same macroeconomic assumptions. In addition, it incorporates $950 billion of new revenues on the assumption that the 2001 and 2003 tax cuts for high earners lapse from 2013 onwards, as the Administration is advocating. In this scenario, we project that the net general government debt would rise from an estimated 74% of GDP by the end of 2011 to 77% in 2015 and to 78% by 2021.

Our revised downside scenario--which, other things being equal, we view as being consistent with a possible further downgrade to a 'AA' long-term rating--features less-favorable macroeconomic assumptions, as outlined below and also assumes that the second round of spending cuts (at least $1.2 trillion) that the act calls for does not occur. This scenario also assumes somewhat higher nominal interest rates for U.S. Treasuries. We still believe that the role of the U.S. dollar as the key reserve currency confers a government funding advantage, one that could change only slowly over time, and that Fed policy might lean toward continued loose monetary policy at a time of fiscal tightening. Nonetheless, it is possible that interest rates could rise if investors re-price relative risks. As a result, our alternate scenario factors in a 50 basis point (bp)-75 bp rise in 10-year bond yields relative to the base and upside cases from 2013 onwards. In this scenario, we project the net public debt burden would rise from 74% of GDP in 2011 to 90% in 2015 and to 101% by 2021.

Our revised scenarios also take into account the significant negative revisions to historical GDP data that the Bureau of Economic Analysis announced on July 29. From our perspective, the effect of these revisions underscores two related points when evaluating the likely debt trajectory of the U.S. government. First, the revisions show that the recent recession was deeper than previously assumed, so the GDP this year is lower than previously thought in both nominal and real terms. Consequently, the debt burden is slightly higher. Second, the revised data highlight the sub-par path of the current economic recovery when compared with rebounds following previous post-war recessions. We believe the sluggish pace of the current economic recovery could be consistent with the experiences of countries that have had financial crises in which the slow process of debt deleveraging in the private sector leads to a persistent drag on demand. As a result, our downside case scenario assumes relatively modest real trend GDP growth of 2.5% and inflation of near 1.5% annually going forward.

When comparing the U.S. to sovereigns with 'AAA' long-term ratings that we view as relevant peers--Canada, France, Germany, and the U.K.--we also observe, based on our base case scenarios for each, that the trajectory of the U.S.'s net public debt is diverging from the others. Including the U.S., we estimate that these five sovereigns will have net general government debt to GDP ratios this year ranging from 34% (Canada) to 80% (the U.K.), with the U.S. debt burden at 74%. By 2015, we project that their net public debt to GDP ratios will range between 30% (lowest, Canada) and 83% (highest, France), with the U.S. debt burden at 79%. However, in contrast with the U.S., we project that the net public debt burdens of these other sovereigns will begin to decline, either before or by 2015.

Standard & Poor's transfer T&C assessment of the U.S. remains 'AAA'. Our T&C assessment reflects our view of the likelihood of the sovereign restricting other public and private issuers' access to foreign exchange needed to meet debt service. Although in our view the credit standing of the U.S. government has deteriorated modestly, we see little indication that official interference of this kind is entering onto the policy agenda of either Congress or the Administration. Consequently, we continue to view this risk as being highly remote.

The outlook on the long-term rating is negative. As our downside alternate fiscal scenario illustrates, a higher public debt trajectory than we currently assume could lead us to lower the long-term rating again. On the other hand, as our upside scenario highlights, if the recommendations of the Congressional Joint Select Committee on Deficit Reduction--independently or coupled with other initiatives, such as the lapsing of the 2001 and 2003 tax cuts for high earners--lead to fiscal consolidation measures beyond the minimum mandated, and we believe they are likely to slow the deterioration of the government's debt dynamics, the long-term rating could stabilize at 'AA+'.

On Monday, we will issue separate releases concerning affected ratings in the funds, government-related entities, financial institutions, insurance, public finance, and structured finance sectors.

 
Unsecured Loans Proudly Powered by Blogger