Thursday, November 24, 2011

Back to ten percent?

Here is the one-day performance of the Irish government bond nine-year yield as calculated by Bloomberg.

Bond Yields 1D 24-11-11

So much for bond yield tranquillity!  And this is not too different to what was happening on November 24th 2010 only this time we’re going one percentage point higher.

How much austerity have we had?

Here is an exchange from last week’s meeting of the Joint Committee on Finance, Public Expenditure and Reform Debate which was attended by members of the Independent Fiscal Advisory Council.

Deputy Mary Lou McDonald: Far from viewing Professor McHale as cautious or conservative, my reaction to his contention that the austerity should be greater and quicker is that it is reckless. I would like him to give us the rationale for his commitment to austerity. Where is the evidence it is working? We have not seen a dramatic reduction in the underlying deficit despite €20 billion having been sucked out of the economy.

Professor John McHale: Deputy McDonald asked if the austerity is working. By that I understand her to mean if it is succeeding in bringing down the deficit. The question is sometimes asked whether attempts at deficit reduction is self-defeating in that the deficit does not come down. In my view it is working. Our assessment of the numbers is that it is working. The overall general government deficit fell from 11.7% of GDP in 2009, and the most recent projection is that it will be 10.3% of GDP for this year, so that is a reduction. The Exchequer deficit for the first ten months-----

Deputy Mary Lou McDonald: Is that a satisfactory rate of decrease?

Professor John McHale: That is a good question. It looks like the Exchequer deficit for the first ten months of this year will be €1.8 billion lower than it was for the first ten months of last year.

In making an assessment, we have to recognise that austerity is not the only factor slowing down the economy. There are significant forces pushing the Irish economy down and this refers to the earlier discussion of the balance sheet recession. There are significant issues of confidence and issues of credit access. This economy has been hit with a number of very severe shocks that have been slowing growth and particularly slowing the growth of domestic demand, which is critical to the fiscal position.

The Deputy is correct that these numbers as regards improvement in the deficit are not startling in the sense that the deficit is on this incredibly slow downward path but the fact that this has been achieved in the face of such headwinds shows that it is actually working. It is hopefully a question of when we get back to growth and the measures taken, such as the new tax and expenditure structures, will yield much more. When we get back to growth and, particularly and crucially, growth in domestic demand which is affected by much more than just the austerity measures themselves, the expectation and the hope is that the deficit will improve more rapidly.

Using our fiscal feedback model, we have also conducted simulations of what would have happened if there had been no adjustment at all. The Deputy referred to the €21 billion adjustment which has taken place so far. On conservative assumptions, the deficit in 2011 would have been 20% of GDP instead of the projected 10.3% if there had been no measures taken. We would be heading for a debt to GDP ratio in 2014 to 2015 of approximately 180% of GDP. We would be fast becoming like Greece. We would probably never get there because we would probably have ended up in default before then.

The question here is not so much on whether austerity is working but on what exactly entails the “€21 billion adjustment” which is referred to in the exchange. The McCarthy Report on State Assets provides a useful summary of the measures that have been introduced up to this year.

Budgetary Adjustments

The sum of measure introduced is indeed €21 billion, but has €21 billion been “sucked out of the economy” over the last three years?  The €21 billion was the projected full-year impact of the measures introduced.  Maybe we should look at what actually happened to see how close reality is to this €21 billion.  I think the answer is closer to €10 billion than it is to €20 billion.

To start we will look at what was introduced each time.  First up is the €1 billion of measures introduced in July 2008.  Here is the list from the Minister’s statement.

  • All Departments, State Agencies and Local Authorities – other than Health and Education - will be required to reduce their payroll bill by 3% by the end of 2009 through all appropriate measures identified by local management in the light of local circumstances. The parameters of this exception for the health and education sector are to be agreed by the Departments concerned with the Department of Finance.
  • All expenditure by Departments and Agencies on Consultancies, Advertising and Public Relations will be significantly reduced for the remainder of this year and by at least 50% in 2009.
  • Further savings in 2008 and in 2009 are to be secured by a range of measures including those identified as a result of the Budget day efficiency review initiated by my predecessor.
  • All of the above efficiencies will apply equally to State Agencies. In addition, I have asked that these agencies be reviewed to examine whether they can share services, whether it would be appropriate to absorb some of their functions back into their parent Departments or whether some agencies should be amalgamated or abolished. The outcome of this will be considered by the Government in the Autumn.
  • The Government has also decided, in the light of the current Exchequer position, that further expenditure for the acquisition of accommodation for decentralisation will await detailed consideration of reports from the Decentralisation Implementation Group.
  • Minister of State Martin Mansergh will head up a joint public procurement operation between OPW and the Department of Finance to drive a programme of reform and to produce a business plan for purchasing savings to be achieved by Departments and other public bodies in 2009. Minister Mansergh will report to me in the Autumn with specific proposals to target at least €50m savings in 2009 on this front.
  • Given the projected revision to GNP and other factors, there will be savings in Overseas Development Assistance of some €45 million this year. The revised total contribution in 2008 will be over €200 per citizen, totalling around €900 million. Ireland will still be far ahead of almost all other developed nations in our rate of ODA.

It is hard to class much of these as anything at all.  There are no tax increases and the expenditure measures are aspiration rather than actual.

The only actual cut was €45 million off the ODA budget.  Outside of Health and Education the pay bill increased from €4.1 billion to €4.3 billion between 2007 and 2008.  I don’t know what effect the announced cut in “Consultancies, Advertising and Public Relations” or “the Budget day efficiency review” had.  Very little I would guess.  This is €1 billion of the €21 billion but I don’t think it resulted in much austerity. 

Lets move to October 2008 and the early introduction of Budget 2009.  This was supposed to have revenue raising measures that brought in an extra €2 billion.  What also seems to be missed is that this budget also had adjustments that INCREASED expenditure.  The announced changes to social welfare in Budget 2009 had a full year cost of over €0.5 billion. 

Fully a quarter of the money that was planned to be raised from extra taxation was spent before the Minister sat down.  This isn’t “sucking money out of the economy”.

In the Budget speech the Minister also told us what happened to the savings made from the measures introduce the previous July:

The savings achieved have already been used to relieve pressures in areas such as:

  • health, where additional provision had to be set aside to meet the costs of a new consultants’ contract and

  • education, where the full year salary costs of about two thousand extra teachers and Special Needs Assistants taken on this year had to be provided.

The “savings” weren’t taken out of the economy; they were spent in the economy.  And what about the €2 billion of revenue measures introduced?  This table provides the full-year revenue effects from the Summary of Budget Measures document.
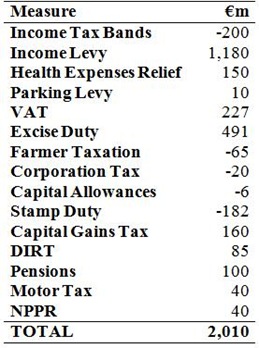
Summary of Tax Measures

These do indeed total €2 billion.  Of course the VAT increase to 21.5% was reversed in the following year’s budget so that €227 million was only temporary.

Although details of DIRT are not provided I would be pretty sure that the increase from 25% to 27% didn’t bring in an extra €85 million.  When the Budget was announced on the 14th of October 2008 the ECB base rate was 4.25%, just six months later it was 1.25%.

The Budget estimate was that Capital Gains Tax in 2009 would bring in €1,700 million.  What was the actual outturn for 2009? €542 million.  It should be fairly evident that increasing CGT from 20% to 22% did not bring in an extra €160 million. Increasing the rate to 25% in the middle of the year was also ineffectual.

We can do the same for Excise Duty.  Here is how the €491 million extra was supposed to be raised.Excise Changes

In 2008, Excise Duty brought in €5.60 billion.  The Budget forecast for 2009 was €5.74 billion.  Instead of rising by €150 million in 2009, excise duty revenue fell €700 million.  Consumption of petrol fell 8.4%, consumption of cigarettes fell 6.7%, consumption of wine fell 6.9%, the betting levy wasn’t increased to 2% and the Air Travel Tax brought in €105 million in its first full year in 2010 and was never applied to “small peripheral airports”.

We’ll come back to the Income Levy but it is clear that the taxation measures introduced did not raise the planned extra €2 billion.  Social welfare measures with extra expenditure of €0.5 billion were introduced.  In the Budget net current expenditure for 2009 was forecast to be €48 billion.  Net current expenditure in 2008 was €45 billion.  And this is a budget that “sucked money out of the economy”? 

Next up is the €2.1 billion of expenditure measures announced just four months later in February 2009.  These measures are summarised in this table.  Of the €1.4 billion to be cut from Public Sector Pay, €1 billion was to be raised by the Pension Levy.  In its first full year in 2010 this returned €916 million, about 9% below the projection. (Can anybody guess why?). 

It is not exactly clear where the other €0.4 billion of savings from Public Sector Pay were supposed to come from or whether they were achieved.  There was also supposed to €140 million of “general administrative reductions”.

We just have to move forward just two months to the April 2009 Supplemental Budget which has €5.4 billion of revenue and expenditure measures.  There was €3.6 billion of tax measures, with €2.8 billion to come from Income Tax changes.  Unfortunately at the time we did not get an individual breakdown of what impact the doubling of the Income Levy, the Health Levy and the increase in the PRSI ceiling would have.  We can use some other forecasts though.

In December it was revealed that when the rates were increased it was believed that the Income Levy would yield “approximately €2 billion in a full year”. In 2010, the first full year of the new rates the Income Levy raised €1,446 million – over half a billion lower than forecast.

In September it was revealed that the 2010 estimate for the Health Levy was €2,489 million which we can assume was close to the forecast used in April.  The actual outturn for 2010 was €2,018 million – nearly half a billion lower than forecast.

I think we can take it that the change in the PRSI ceiling did not bring in as much as was forecast.  It was announced that €2.8 billion of Income Tax measures were being introduced.  The actual impact of them was much lower.  The was nearly €160 million of capital tax measures announced and another €150 million excise duty measures which likely suffered a similar fate.

At the time of the 2009 Budget the previous October the estimate was that gross current expenditure would be €61,782 million in 2009.  The actual outturn of gross current expenditure for 2009 was €60,711 million – a reduction of €1,071 million.

The February package included €790 million of full-year cuts in gross current expenditure.  The 2009 savings would be slightly lower, lets say €600 million.   The Supplemental Budget in April also included €886 million of cuts to gross current expenditure for 2009 (€1,215 over a full year).  Combined these €1,486 million of cuts saw expenditure come in €1,071 lower.

Again it is hard to pin down where the failure arose.  The expenditure measures were not very specific apart from axing the Christmas bonus payment for social welfare recipients (€171 million), yet another reduction in the overseas development aid budget (€100 million) and the abolition of the Early Childcare Supplement (€105 million) .  There was €82 million to be saved in Social Welfare from “general control measures” and €150 million of payroll savings from a “range of initiatives”.

The Supplemental Budget announced that the 2009 capital programme would be reduced by €576 million on top of the €300 million announced in February.  This was delivered on.  The Budget estimate was that gross capital expenditure would be €8,231 million.  The outturn was €7,329 million -  a reduction of €902 billion.  There seems to have been an abject failure to reach the levels announced for the measured announced in the current budget, but this appears to have been different in the capital budget.

Next up was the €4.3 billion of expenditure cuts and tax increases announced in Budget 2010.  There was €0.1 billion of tax measures and, €3.1 billion of current expenditure measures and €1.0 billion of capital expenditure measures.

The biggest current expenditure measure was the graduated 5% to 10% reduction in public sector salaries which was estimated to “lead to savings of over €1 billion in 2010 and in a full year”.  These savings are of course in gross pay.  Public sector workers were not €1 billion worse off because of the pay cut so the government could not be €1 billion better off because of the pay cut.

The government lost out on the income tax, income levy, health levy and PRSI it would have collected on the pay.  The pay of a public sector worker earning €50,000 was reduced to €47,000 as a result of the pay cut (Annex D).  The net pay of this worker would have fallen from €33,181 to €31,963.  The government might have made a gross pay saving of €3,000 but the employee’s net pay fell by €1,218. 

The pay cut might have knocked €1 billion off the gross pay bill but it could not have sucked €1 billion out of the economy.  There was also €800 million of cuts announced in the social welfare budget and these are actual cuts to recipients as there is no tax involved.  Even with these the level of social welfare transfer payments increased from €20.9 billion in 2009 to €21.0 billion in 2010.

There was about €1 billion of expenditure cuts outside of social welfare but most are small and difficult to evaluate.  Yet again, the Capital Budget took a relatively large share of the burden.  In 2009 gross voted capital expenditure was €7,329 million; in 2010 it was down to €6,256 million.

And finally we have the €6 billion from Budget 2011.  Obviously it will be much harder to see if the targets set for these measures are being delivered upon as it will be another few months before we can know the final year outturns for 2011.  The full-year impact of the measures introduced was:

Six Billion Budget

These do indeed sum to €6 billion.  However in this instance the “full-year impact” are actually the 2014 impacts rather than the impact that the measure will have in its first full year.

The revenue forecasts for 2011 are going a lot better than in previous years, but by September was still about €400 million below expectations.  It is likely that the revenue measures are achieving most of their targets.

On the current expenditure a lot of the cuts were real and reduced the incomes of many.  Several others were not quite so ground.

  • Social Welfare: A reduced live register from a more intensive labour activation strategy: €100 m
  • Health: Demand Led Schemes savings (drug costs and professional fee payments): €390 million
  • Health: Other procurement and non-core pay cost savings: €200 million
  • Health: Estimated payroll saving from voluntary exit package in HSE: €123 million
  • All Departments: Miscellaneous “Administrative efficiencies”: €513 million

These €1,326 million of “measures” account for 60% of the current expenditure measures announced last December.  There was €546 million of measures introduced based on the reduction of social welfare payments.  At the end of October net current expenditure was €571 million “below profile” it was stated that this was “mainly as a result of the timing of certain payments”. 

It will be the year end before we can judge if the expenditure targets were met.  In 2010 gross current voted expenditure was €54,265 million.  In the Medium Term Fiscal Statement it is forecast to be €53,240 million in 2011 – a reduction of €1 billion.

Once again, the savings on the capital budget are fairly decisive.  Gross voted capital expenditure in 2010 was €6,256 million.  This year it is estimated to be €4,640 million – a reduction of €1.6 billion.

There are some changes left out of the €21 billion starting total.  The February 2009 announcement also included the following:

In addition, the increases provided for under the Review and Transitional Agreement with effect from 1 September 2009 and 1 June 2010 will not now be paid on those dates. Further discussions in relation to these increases will be held in 2011, without prior commitment. This will save a total of €1 billion 2010.

Of course this is just deciding not to spend money that wasn’t been spent in the first place.  The Pre-Budget Outlook published prior a month before Budget 2010 included €750 million of cuts to the capital budget.  The €961 million of capital cuts announced in the Budget were on top of that.

So how much money has actually been sucked out of the economy?  The €21 billion figure is based on an estimate of full-year effects of the measures made at the time the measures were introduced.  The Department of Finance forecasts did not perform well, particularly early in the crisis and especially on the taxation side.

For example, the figures from Budget 2009 led to a forecast total tax revenue of €42,780 billion.  Tax revenue in 2009 was €33,043 million.  The forecast error is almost 25%.  It is wrong that we should be sticking to the €21 billion “austerity” total cost when it is clear that this is not what has actually happened. 

Looking back over the six packages of cuts and tax increases introduced up to now we can summarise them as follows:

Total Budget Measures

As a result of the half a billion of social welfare measures introduced in October 2008 the total is actually closer to €20 billion rather than the €21 billion figure commonly used.  Of course it would be better if the actual impact of these measures than the incorrect projected impact was used.

Let’s look at what has happened to the three areas:
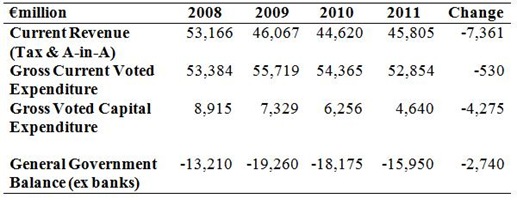
Budget Outcomes

Compared to 2008 voted expenditure is down €4.8 billion (although nearly 90% of this relates to capital expenditure).  Over the same period current revenue is down almost €7.4 billion.  Although there are other elements to the budget not included here (non-tax revenue, non-voted expenditure) it is hardly surprising the deficit is higher now than it was in 2008, though it has been falling since 2009 (excluding the bank payments).

Capital expenditure has fallen €4.3 billion over the period even though €3.5 billion of cuts are in the austerity total.  The gap is explained by the November 2009 €0.8 billion of capital cuts that is not included.  Capital expenditure is bearing the brunt of the cuts so far.  As this is mainly the cancellation of projects that hadn’t even begun the victims of capital cuts are unknown even to themselves.

Almost €9 billion of current expenditure cuts have been announced but gross voted current expenditure is only €0.5 billion lower than it was four years.  There has been substantial shifts within that total.  At an individual level public sector pay has been cut and many social welfare payments have been reduced.  These are real cuts to the individuals and households.  However, at the aggregate level current expenditure is largely where it was four years ago.

Almost €8 billion of revenue raising measures have been introduced over the period, but revenue is actually €7.4 billion less than it was four years ago.  Once reason for this are the large over-estimates of the impact of the measures by as much as 25% in some cases.

How much austerity have we actually endured?  That is not a question that can be answered in a simple analysis such as this.  If it was €20.8 billion then that would be a average of €4,500 for every man, woman and child in the country or an average of €18,000 per family of four.  There have been tax increases and expenditure cuts but nothing on a scale like that.

I would guess that given the woolly nature of some of the current expenditure measures, the huge overestimates of the impact of the revenue measures, and the actual cuts in the capital budget the last three years has been around €12 billion “sucked out of the economy” with nearly 40% of that as a result of capital expenditure cuts.  This is only a guess. It would be useful if the actual figure was produced.

Monday, November 21, 2011

Public Sector Pay Once Again

This is old ground but somehow we keep having to go over it.  Yesterday’s Sunday Independent features an incredible article from James Fitzsimons, who “is an independent financial adviser specialising in tax and financial planning”.  It is incredible because it contains so many errors.  It is nearly difficult to know where to begin.

THE Government that lives in La-La Land has just created Disneyland for 300,000 public servants.

There are around 350,000 public servants in Ireland.  The breakdown of these is provided in Table A2 of the Earnings and Labour Costs Survey from the CSO (see page 15).

The 300,000 number that is commonly used is the number of full-time equivalent public servants.  Staff employed on a part-time basis and those engaged in job-sharing are only included on a pro-rata basis to get to the 300,000 figure.  The latest figure from the Department of Public Expenditure and Reform is that there were 302,769.7 full-time equivalents in the public sector in Q2 2011.

It is proposed to cut 37,500 jobs by 2015. This is 11.72 per cent of the 2008 figures when they were at their peak. Mr Howlin claims the gross public sector pay bill will fall by €2.5bn.

Based on CSO figures, the average earnings are €901.07 per week in the public sector. The savings for a cut of 37,500 jobs would be about €1.76bn a year. If 10 per cent of earnings constituted tax, the real saving would be less than €1.6bn.

When working out the reduction in the gross public sector pay bill compared to 2008, Fitzsimons focuses solely on the 37,500 reduction in headcount and completely overlooks  the average 7% pay cut for all public servants that was announced in the December 2009 Budget.  The reduction in the gross pay bill from this measure was almost €750 million.  Once this is included it is clear the the €2.5 billion claim from Brendan Howlin is not that wide of the mark.

Fitzsimons then goes on to calculate some measure of “net savings”.  This time he seems to omit the impact of the Public Sector Pension Levy introduced in April 2009.  This levy had no impact on gross pay but did reduce net pay (by around €1 billion).

It is incredible that someone “specialising in tax” would suggest that 10% of earnings constitute tax.  The average earnings figure he uses (which we will return to) is equivalent to an annual income of just under €47,000.  Using a fairly simple tax calculator it can be seen that the net pay for a public sector worker is €30,600.  Of the €16,400 of deductions €2,200 is a pension contribution so the tax on this average worker is €14,200.  That is 30% of gross pay.  Why is a figure of 10% used in the article?

According to the CSO average pay in the public sector is €901.07 compared to €611.88 in the private sector.  We have previously considered the impact our progressive tax system has on the 47% differential.

It is also important to note that the average of €901.07 provided by the CSO is based on around 400,000 public sector workers.  This is because it includes just over 50,000 employees in semi-state companies.  These are not paid from government resources and have not been subject to the pay cuts, levies and other changes introduced in the public sector.

I have asked the CSO to provide a breakdown of average wages in the public sector under the same headings used in Table A2 in the Earnings and Labour Costs release.  I have been told that this figure is not available.  The €901.07 average is likely higher because of pay in the semi-states.

The McCarthy Report on state assets reports (Table 4.4, page 23) that average pay in December 2009 for the 40,000 employees in the semi-states considered under the terms of reference of the report was €54,600 or €1,050 per week.  If we apply this to the CSO data it means that average weekly pay for the public servants in the total is around €880.

A 2% difference may not seem that significant it would be useful if the correct figure was available.  I have made further requests to the CSO but nothing has been forthcoming.

If the average pay in the public service were brought in line with the private sector, it would be cut by 30 per cent. This is without taking account of the cost of public sector pensions. It would achieve annual savings of €5bn to €6bn. We need this now, not in 2015 or 2020.

We can get some crude measures using The Analysis of Exchequer Pay and Pensions 2006-2011 which gives total pay and employment numbers across a number of categories.  The measure of gross pay given here includes salaries, employers’ PRSI and employers’ pension contributions.  The figures given here are for 270,000 public servants paid from the Exchequer.  The table excludes about 30,000 local authority employees.  The total public sector pay bill will be around 10% higher than the figures given here.

Exchequer Pay

In 2008 the gross Exchequer pay bill was €17.7 billion.  In 2011 it will be €16.2 billion.  There has been a drop of €1.5 billion or 8%.  Brendan Howlin is projecting a  further fall of €1 billion and a total drop of 14% on the 2008 level.

Exchequer net pay is calculated by subtracting employee pension contributions (€534 million in 2010), the public sector pension levy (€916 million) and some other minor appropriations-in-aid (€59 million).  Exchequer net pay has fallen from €17.1 billion in 2008 to €14.8 billion in 2011, a drop of 14%.  The projected fall to 2015 will be around 20%.

If a measure of net pay was provided to account for Income Tax, the changes to income tax would mean that the fall in net pay from the employees’ perspective would be greater than the 14% shown above.  We previously estimated this to be 17% for a public sector worker earning the average wage published by the CSO.

Fitzsimons argues that public sector pay should be cut by 30% now.  There is no evidence to support the claim that this will bring it “in line with the private sector”.  A 30% reduction in the 2011 gross pay bill would be €4.9 billion (or around €5.5 billion if local authorities are included).  It is claimed that this would “achieve annual savings of €5bn to €6bn”.

The actual saving would be much lower.  When questioning Howlin’s €2.5 billion figure at the start of the article Fitzsimons argues that the actual saving  would be lower because of lower tax revenue.  However when it comes to his own figure of €5-€6 billion he makes no such adjustments.

The cut in gross pay would reduce employee pension contributions (estimated c. €0.3 billion) , pension levy receipts (c. €0.3 billion) and income tax receipts (c. €1.25 billion).  Of course, there would also be loss of VAT and Excise Duty receipts as the pay reduction reduces consumption expenditure. 

The actual saving from a 30% cut in average pay in the public sector would actually be closer to €3 billion and not the €5-€6 billion claimed in the article.  If we went the whole hog and cut public sector pay by 100% the actual saving would be around €10 billion.  The deficit in 2011 will be €16 billion.  Public sector pay is not the only reason for the deficit so cannot be expected to be the only solution.

Public servants might have to suffer the same increases in VAT as the rest of us, but they have 50 per cent more income to cover the cost.

People pay VAT from net pay not gross pay.  Public servants have a higher gross pay than private sector workers but the effect of a progressive tax system and the Public Sector Pension Levy substantially narrow the gap.  The Pension Levy is not a pension contribution but is just a pay deduction.  This was made clear by Brendan Howlin in the Dail a few weeks ago.

The Trident report assumes that the pension related deduction, commonly called the public service pension levy, is a pension contribution. This is mistaken and the law could not be clearer. Section 7(2) of the Financial Emergency Measures in the Public Interest Act 2009 states: “(2) A deduction under section 2 is not a pension contribution for the purposes of the Pensions Act 1990”. The pension levy contribution is a misnomer. It was called that by the previous Government, but it is a levy on pay.

I hope it will not be a permanent feature, as I said to the unions when I met them. In my judgment, it is mistake for unions to characterise it as a pension contribution because the fear will be at a future date that it will be subsumed into the calculation of pension contributions. Under the auspices of the Financial Measures in the Public Interest Act 2009, it is not, by definition, a permanent measure. I hope it will not be a permanent measure, but, obviously for the foreseeable future, it is required.

Maybe it is too much to expect a tax specialist to know the difference between gross pay and net pay.  To finish here is the conclusion to my previous post on public sector pay.

This doesn’t mean that public sector pay should not continue to fall by more than private sector pay. A staggered wage cut from 0% for those at the bottom (with possibly even some increases) rising to maybe a cut of 12.5% through to the top of payscale (and maybe even more targeted than that), along with forthcoming general changes in income tax could bring the average fall in net pay in the public sector to 25% (with most of the latter burden shared by those above the average wage). 

A 25% cut in net pay would be a huge contribution from the public sector but what needs to be remembered is that with a 17% cut in net pay we are already two-thirds of the way there.  At times this seems to get forgotten in the ongoing pay debate.

And that is a 25% reduction in average net pay for those who are in the public sector.  By 2015 there will also have been a 10% reduction in the number of full-time equivalent employees in the public sector.

Thursday, November 17, 2011

Bond yield tranquillity

There has hardly been a day in the past fortnight when bond yields have been outside the top three stories in the news.  However, it is been Greece, Italy and Spain and latterly Belgium and France that has been attracting the attention.  Our bond yields have already caused a peep.  Here is the nine-year Irish government bond yield as calculated by Bloomberg for the past month.

Bond Yields 1M to 17-11-11

For the past month yields have been in a range between 8.1% and 8.6% and are at the lower end of that range now.  It could be that attention is directed elsewhere but it is noteworthy nonetheless.

Also interesting is following graph which gives the relative performance of Irish nine-year yields and German ten-year yields for the past year.  A reading of 0 means the yield is unchanged relative to the yield on the starting day of the graph.  A reading of 100 means the yield is twice as high.

Irish v German Yields 1Y to 17-11-11

Irish bond yields are at almost the exact level they were at 12 months ago (8.1%).  The surge in the summer ahead of the July 21 summit is clearly visible and that quickly dissipated which these gains largely maintained.  German yields are about 33% lower than they were this time last year (2.6% down to 1.8%).

How are Irish yields relative to those of France?

Irish v French Bond Yield 1Y to 17-11-11

French yields took the same downward pattern as those of Germany during August and September but have been rising since the start of October and are now about 20% higher than they were this time last year.

On a pure price basis compared to this time last year:

  • a German bond is worth more
  • an Irish bond is worth about the same, and
  • a French bond is worth a bit less

What does this mean? Not a whole lot.  It does suggest that we have gotten most the uncertainty surrounding the solvency of the State into the open, in particular in relation to the banks.  Clearly there are doubts that remain (reflected in the yield above 8%) but in a period of European volatility the relative tranquillity in the Irish setting is interesting.

Thursday, November 10, 2011

Core inflation stays low

The headline rate of inflation from today’s Consumer Price Index release is 2.8%.  However 2.33 percentage points of that are accounted for by just two categories: energy products and mortgage interest.  These make up about 15% of the index.   Mortgage interest is up 18.1% on the year and energy products are up 13.4% on the year.

The remaining 85% of the index, which we are using as a measure of ‘core’ inflation, contributes just 0.47 percentage points to the overall inflation rate and is showing annual inflation of 0.55%.

Core Inflation October 2011

The headline rate is inflation is nearly 3% but outside of mortgage interest (and it is only standard variable rates that are picked up in the index) and energy products inflation remains low.

Wednesday, November 9, 2011

The deficit and “the banks”

The Medium Term Fiscal Statement released last Friday projects that the general government deficit in 2012 will be €13.6 billion or 8.6% of GDP.  This is the number we have to reduce to less than 3% of GDP by 2015, which is what measures to be introduced over the next few Budgets will be targeting.

The simple question here is: how much of the €13.6 billion deficit is due to the banks?

So far we have poured about €62.5 billion into AIB, BOI, EBS, PTSB, Anglo and INBS and all of this has been accounted for in the general government deficits of the last three years.  No further payments are planned so there are no direct payments to the banks in the €13.6 billion deficit for 2012.

What about providing this €62.5 billion?  Surely there are huge interest costs associated with providing this money to the banks.

Of this money €17 billion came from the destruction of the savings we had built up in the National Pension Reserve Fund.  This money was not borrowed so there are no interest costs.  There is the loss of income that this money could have earned but this loss has no bearing on the general government balance.

Of the remaining €45.5 billion almost two-thirds is accounted for by the Promissory Notes given to Anglo and INBS in 2010.  This €30.6 billion was included in full in the €49 billion general government deficit in 2010 and due to some complications in their construction there will be no interest paid on these notes in 2012. 

In 2011, a cash payment of €3.1 billion was made on the Promissory Notes.  This will not affect the debt as the €3.1 billion simply changes from being a Promissory Note debt to a cash debt.  There is now around €28 billion of Promissory Notes outstanding but this will have no impact on the €13.6 billion general government deficit for 2012.

That means we are down to the final €18 billion.  This is split between €11 billion paid from the Exchequer and €7 billion taken as part of the EU/IMF programme.  The money from the Exchequer includes €4 billion given to Anglo in 2009 and €3 billion paid into the NPRF in the same year to help fund the initial recapitalisation of AIB and BOI.  It also includes the €3 billion payment made on the Promissory Notes this year.  It is safe to assume that all of this money was borrowed (or at least increased our borrowing by the same total which amounts to the same thing).

The €7 billion from the EU/IMF was used to fund the State’s  €17 billion contribution to the  €24 billion recapitalisation of the banks this year.  The other €7 billion came from haircuts to subordinated bondholders, some minor asset disposals and some private sector investment in BOI.

We will assume that the average interest rate on this €18 billion is around 4.5%.  At this interest rate, borrowings of €18 billion would require an annual interest payment of around €800 million.  This interest cost does form part of the general government balance for 2012.

If we do a simple counterfactual and magic away the €62.5 billion we have pumped into the banks, the projected deficit for 2012 would fall from €13.6 billion to €12.8 billion or 8.0% of GDP.  Eliminating the effect of the bank payments would knock 5% off the deficit; 95% of next year’s deficit is not related to the bank payments.

There are many claims that the expenditure cuts and tax increases are being introduced to “bail out the banks”, “repay bondholders” and the like.  The changes are being introduced to bring about the necessary reduction in the budget deficit.  There may be disagreements about the make-up of the changes but 95% of the problem there are trying to address is not as a result of the money we have handed over to the banks.

Friday, November 4, 2011

Ireland and Iceland

As Greek fatigue threatens to overcome us all, it may be useful to draw comparisons between Ireland and a country other than Greece.  There have many occasions when comparisons have been made between the differing approaches of Ireland and Iceland to their respective banking crises.  One indicator that is frequently used to aid the comparison is the unemployment rate in both countries. 

The IMF put unemployment in Iceland at 7.5% in contrast to 14.5% in Ireland – a rate that is almost twice as large.  This formed part of a recent presentation from Paul Krugman.  You can watch a 15-minute video of Krugman deliver the presentation here (go to 52:00 of the Session II: Road to Recovery video).

However, this unemployment snapshot only paints a partial picture.

Ire Ice Unemployment

Icelandic unemployment is significantly lower, but it also started from a much lower level.  The unemployment rate in Iceland was 7.5 times larger in 2010 than it was in 2007 (1.0% to 7.5%).  In Ireland the increase was 3.1 times (4.6% to 14.5%).  In Iceland, the unemployment rate increased by 6.5 percentage points, here it rose by 9.9 percentage points.  There is no doubt that unemployment in Ireland is higher and has risen by more than unemployment in Iceland.

As Krugman does, we can account for migration by looking at changes in employment.  Since 2007, the number of people employed in Ireland has fallen further, but the Icelandic figures is somewhat invariant because of the units used by the IMF (tens of thousands with Icelandic employment forecast to be completely unchanged at 150,000 over the four years from 2009 to 2010).

Ire Ice Employment

Since 2007, employment in Iceland has fallen 6% while in Ireland the fall has been over 14%.  However, it is hard to argue that this is as a result of the response to the crisis given the huge collapse that has occurred in construction employment in Ireland.  Since 2007, there have been more job losses in the construction sector in Ireland than there are people working in Iceland.

What happens if we move on from unemployment and employment and look at other macroeconomic indicators.  Krugman doesn’t seem to be a fan of using GDP for small open economies but it seems a reasonable place to start.

Ire Ice Total Real GDP

Judging by the IMF forecasts the “roads to recovery” of Ireland and Iceland are almost side-by-side.  There are also graphs of an index of real GDP per capita and GDP per capita at PPP by clicking the links.

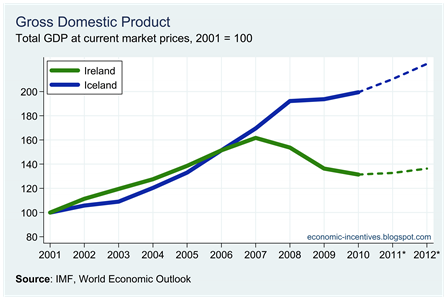
An interesting picture begins to emerge if we look at the relative performances of nominal GDP.

Ire Ice Total Nominal GDP

There is a huge break from the onset of the crises in both countries in 2007/08.  Clearly, with the real GDP indices of both countries tracking each other over the same period there must be some significant price effects.  This can be seen if we look at an index of consumer prices.

Ire Ice Price Index

Annual inflation in Iceland has been higher than in Ireland since 2004 but this gap ballooned in 2008 when Icelandic inflation was 18% compared to just over 1% in Ireland.  The annual inflation rates can be seen here.

Next is the gross government debt to GDP ratios for both countries.

Ire Ice Gross Government Debt

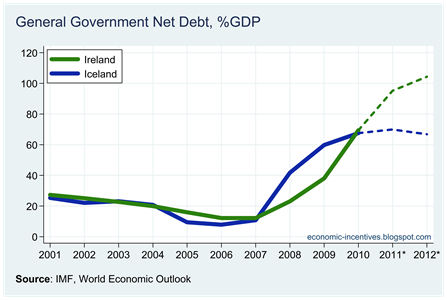
Spot the difference!  In 2007, both countries had a gross debt to GDP ratio of just under 30%.  By 2010 both had ballooned to around 95%.  And note that the Ireland ratio was pulled up with the price deflation in the denominator, while Iceland was experiencing inflation of almost 20% in its denominator.  The Icelandic debt level rose faster and is forecast to moderate at a lower level.  The same can be seen for government net debt.

Ire Ice Net Government Debt

Iceland does better when the comparison is based on unemployment.  The comparison is not so positive if GDP, inflation and government debt are included.  The same is true if we look at the current account of the Balance of Payments.

Ire Ice Current Account

The Icelandic current account has been improving but this is more to do with a collapse in imports rather than a rise in exports.  Finally here is the investment share of GDP in both countries.

Ire Ice Investment Share of GDP

All in all, there does not seem to be a lot to separate the two countries.  Both have had banking collapses.  Both have struggled to deal with them.  Iceland is perceived as being in a better position but that is not really borne out in the IMF data.

Tuesday, November 1, 2011

Some general government debt developments

Back in May, Morgan Kelly snapped us out of a Saturday morning stupor with another thought-provoking article in The Irish Times.  Among many topics the issue of Ireland’s public got an airing.

Irish insolvency is now less a matter of economics than of arithmetic. If everything goes according to plan, as it always does, Ireland’s government debt will top €190 billion by 2014, with another €45 billion in Nama and €35 billion in bank recapitalisation, for a total of €270 billion, plus whatever losses the Irish Central Bank has made on its emergency lending. Subtracting off the likely value of the banks and Nama assets, Namawinelake (by far the best source on the Irish economy) reckons our final debt will be about €220 billion, and I think it will be closer to €250 billion, but these differences are immaterial: either way we are talking of a Government debt that is more than €120,000 per worker, or 60 per cent larger than GNP.

This €250 billion projection was immediately latched onto and generated some articles in response from Murphy and Leddin & Walsh.  In both cases the €250 billion estimate was said to be the result of “double-counting” and other errors.

However, I think the Kelly analysis is technically correct but is inflated by some overly pessimistic assumptions.   It may seem like this is going over old ground but it does give a starting point to summarise the debt developments that have occurred since May.

Up to today it was believed that the general government debt at the end of 2010 was €148 billion.  From the four-year National Recovery Plan (page 110) the planned general government deficits for the years 2011 to 2014 were forecast to be €15 billion, €12 billion, €10 billion and €5 billion.  These are exclusive of any banking costs.  Adding these deficits for 2011-2014 to the 2010 debt of €148 billion brings us to the €190 billion starting point of Morgan Kelly.  There is no double counting of bank-related sovereign debt.

These deficits were revised up in April’s Stability Programme Update (page 50) by a cumulative €8 billion to a total of €50 billion.  The reduction in the interest rates on our EU loans will have brought this down again and this is likely to be reflected in the revised macroeconomic projections to be released by the Department of Finance on Friday.  Of course the starting point in 2010 was reduced by just under €4 billion as a result of a real double counting error in the Department of Finance.  Between the ups and downs it looks we are looking at a 2014 debt of around €190 billion before we start adding bank-related debt.

Thus far, this is equally as  pessimistic as Morgan Kelly so we better inject some optimism into proceedings.  From €190 billion he adds €35 billion for bank recapitalisation and €45 billion for NAMA.  While these figures have an actual basis (and were used in the original Namawinelake estimate) it is now commonly accepted that they will not be simple additions to our government debt.

The €35 billion figure was the “worst-case” contingency amount set aside to recapitalise the banks as part of the EU/IMF programme.  As we know the actual recapitalisation amount was €24 billion as revealed in the March PCAR announcement.  As a result of haircuts to junior bondholders in the banks and some private sector involvement the portion to be covered by the State was around €17 billion.

Of this, €10 billion came from the further destruction of the savings built up in the National Pension Reserve Fund so will not add to our debt.  Although we poured €17 billion into the banks this year, only €7 billion of this is to be added to our debt as €10 billion came from our existing resources.

Some of the money not used will be diverted to the credit union sector where it is anticipated that up to €1 billion could be used to prop up ailing credit unions.  This will add to the general government debt.

The official general government debt (GGD) measure excludes NAMA so we are now looking at a 2014 GGD of around €198 billion.  Using the IMF’s nominal GDP forecast for 2014 of €174 billion this would put the debt-to-GDP ratio at 114%, and it is projected to fall from that point on.  This does not account for three assets that will also be on the balance sheet:

  1. €15 billion of cash we had on deposit at the end of September
  2. €5 billion in the remaining portion of the NPRF
  3. €3 billion of contingent capital provided to the banks to be returned in 2014.
  4. Possible resale value of the banks (AIB, PTSB and 15% share in BOI)

It is hard to put a value on the banks and hopefully the view that they have “moved from being a liability to an asset on Ireland’s balance sheet” will gain a greater foothold.  It is easy to suggest that the above four items would reduce Ireland’s net debt to GDP ratio to below 100%.  If you prefer GNP as the appropriate measure of the Irish economy we are probably looked at a net debt to GNP ratio in 2014 that will be less than 125%.  Large but not terminal.

The €45 billion figure for NAMA was the estimated total if all property and construction loans of more than €5 million in the participating banks (AIB, BOI, EBS, Anglo and INBS) were transferred to NAMA.  As we know the transfer of developer loans above €20 million was completed.  In total NAMA bought about €72 billion of these loans and paid €31 billion for them.  The loans of less than €20 million were never transferred to NAMA and the expected losses on these were included in the PCAR analysis undertaken by BlackRock Consultants as part of the stress tests so have been accounted for.

It is impossible to know what the final outcome of the NAMA process will be.  NAMA did create €31 billion of bonds to buy the developer debt, but it bought assets which also had a notional value of €31 billion as valued in November 2009.  If these levels were to be maintained beyond the November 2009 valuation date, NAMA would have no effect on our net debt position.

Of course, property prices have not been unchanged since November 2009 and they have tumbled onward ever downward.  The excellent Namawinelake (the “best source on the Irish economy” remember!) estimates that the value of property backing the loans has fallen by a further €6 billion since the NAMA valuation date. 

It is impossible to use this as a projection of possible NAMA losses.  In most cases NAMA has control over the loans and not the assets.  NAMA has been making substantial disposals for the past few months but we are not told if the agency is making a loss or even possibly a profit on these transactions. 

NAMA has the potential to make a call on the State’s resources to cover a shortfall on its operations.  Unless there is almost complete collapse in asset values it is hard to see how this shortfall could be more than €10 billion, and it is likely to be substantially less than that. 

It is not clear that there will be losses on the Emergency Liquidity Assistance (ELA) provided by the Central Bank of Ireland.  The banks have been provided with sufficient capital to absorb the losses on their loan books so they should be able to repay the central bank liquidity.   In fact the chief executive of the biggest user of ELA has said that the State is providing them with €1 billion to €4 billion more than is required to meet all their liabilities.

Even with the net value of NAMA included, the 2014 debt level will not be more than €210 billion and may be closer to €200 billion.  This is truly massive, but the difference between a debt of €200 billion and a debt of  €250 billion is material.  We could not survive a debt of €250 billion. If we have to carry a debt that large we would be in a similar crisis to one that Greece is now having to face up to. 

A €200 billion government debt is massive but it can be carried and does not make default inevitable.  Just like in the domestic mortgage market, it is important to distinguish between a borrower who simply can’t pay and one that just won’t pay.  Of course, unlike most mortgages we have little intention of ever repaying this debt.  We need to get into a position where we can sustainably service the interest costs of the debt.

Greece is bust and cannot carry it’s debt which even in the EC’s baseline scenario is forecast to be close to 190% of GDP by 2014.  In Greece the news has been consistently bad.  In Ireland we have some positive debt developments since the Morgan Kelly piece in May:

  • lower bank recapitalisation costs,
  • lower interest rates on EU loans,
  • and even a lower 2010 debt because of a DoF accounting error.

By 2014 our debt to GGD ratio will be 114%.  Even if we went through the equivalent of the banking crisis again and had to borrow an additional €63 billion for some reason this would bring our debt to around €270 billion which would be 155% of GDP.  We would still not be even within touching distance of Greece if the equivalent of the banking catastrophe was to the hit us again.

Greece is bust and their economy is broken.  The EU deal on the table does not go far enough and cannot rescue Greece.  We can fix the mess we find ourselves in without resorting to the tyranny of default.  It will require hard choices but it can be done.

Now you see it, now you don’t

Just two days ago we asked “where is our money?” when discussing the €24.8 billion of cash we are supposed to have at the end of the year as indicated at the top of page 3 in the Maastricht Letter released a little over a week ago.

Today we learned that €3.6 billion of this cash never even existed in the first place.  The error has to do with the treatment of the Housing Finance Agency (HFA) in the general government accounts.  Prior to 2010 the HFA was a standalone entity whose assets and liabilities formed part of the general government accounts. 

For 2010 the HFA’s financial transactions were assumed into the National Treasury Management Agency so the assets and liabilities of the HFA should no longer be individually included in the general government accounts as the figures are incorporated into the NTMA’s accounts.  To include the HFA’s assets and liabilities again is just double counting and that is just what happened.

The NTMA issued €3.6 billion of government notes on behalf of the HFA and this €3.6 billion of debt was included in both the liabilities of the NTMA and the HFA.  However, the State only owes the €3.6 billion once so the debt of both agencies should not be included in the general government accounts.  Similarly the €3.6 billion appeared on the asset side of both agencies’ balance sheets and also should only be counted once.

The NTMA raised €3.6 billion and placed it “on deposit” with the HFA.  The NTMA counted this as a market deposit even though the money was actually not available for use.  This is usefully explained in this note from the CSO.

As the changes affect both our asset and liabilities positions there is nothing “saved” from the discovery of this error.  The final sentence from the CSO note sums it up nicely.

“Overall, the State is no better or worse off as a result of the correction.”

But at least know we know where some of that €25 billion is.  Let’s hope the remaining €21 billion doesn’t do a similar disappearing trick.

Bond Yields

Last week’s announcements from the latest EU emergency summit did not result in much of a change in the nine-year government bond yield as calculated by Bloomberg.  There has been a slight drop over the past couple of weeks and yesterday’s close at 8.15% was the lowest since the 13th of October.

Bond Yields 6M to 01-11-2011

Last week’s agreement might have had little effect but Greek Prime Minister George Papandreou’s announcement last night of a referendum on the deal has had an effect.

Bond Yields 1D 01-01-2011

This isn’t a big jump and does not have much significance.  It is not significant because yields are still lower than they were last Wednesday (and of course the significance is reduced because we do not plan to borrow from these markets for at least another year). 

 
Unsecured Loans Proudly Powered by Blogger